Best Graylog Alternatives: Top Log Management Picks

Hey, if you’re knee-deep in logs and feeling like Graylog’s setup is more puzzle than powerhouse, you’re not alone. I’ve been there-chasing down configs, tweaking pipelines, and wondering why something as crucial as log management feels like a full-time job. The good news? In 2025, there are some seriously solid alternatives out there from leading companies that make the whole thing smoother, faster, and less of a headache. Whether you’re after open-source flexibility, cloud-native speed, or full-on observability stacks, these tools let you focus on what matters: keeping your systems humming without the endless infra tweaks. Let’s dive into the top ones that devs and ops teams are raving about right now.

1. AppFirst

AppFirst operates as a platform where developers specify application needs, and the system takes care of provisioning infrastructure across different clouds. It includes logging, monitoring, and alerting right from the start, along with options for centralized auditing of changes and visibility into costs per app and environment. Deployment comes in SaaS or self-hosted flavors, working with AWS, Azure, and GCP without requiring custom code for setup like Terraform or YAML.

The focus stays on letting developers handle apps end-to-end, skipping the usual DevOps hurdles. Security standards come built-in, and the setup enforces cloud best practices automatically. It’s designed for teams that want to provision resources quickly, with features for compute, databases, messaging, networking, and secrets management. Overall, it aims to cut down on overhead by abstracting away the infrastructure details.

Key Highlights:

  • Built-in logging, monitoring, and alerting for applications
  • Centralized auditing of infrastructure changes
  • Cost visibility broken down by app and environment
  • Supports AWS, Azure, and GCP
  • SaaS or self-hosted deployment
  • Includes security standards by default

Pros:

  • Reduces need for infrastructure code or custom tooling
  • Allows developers to own apps without DevOps involvement
  • Provides multi-cloud flexibility
  • Offers transparent audit logs for changes

Cons:

  • Relies on abstraction which might limit fine-grained control for advanced users
  • No public pricing details available
  • Primarily geared toward app provisioning rather than deep log analytics

Contact Information:

2. Sematext

Sematext Cloud brings together logs, metrics, and traces into a single view for full-stack observability. It handles log analysis and unifies Docker logs, events, and metrics, with synthetic monitoring for uptime, user interactions, SSL certificates, and network timings. The platform supports real-time monitoring across various environments and integrates with many tools, turning data into insights for performance and costs.

Users can track changes through an audit trail for alerts, dashboards, and access, and it works for teams dealing with modern stacks. Pricing follows a pay-as-you-use model with customizable plans, including a 14-day free trial that requires no credit card. Excess data gets rejected based on set limits to avoid unexpected charges, and paid versions include full access to observability features like integrations and advanced analytics.

Key Highlights:

  • Unifies logs, metrics, and traces in one platform
  • Synthetic monitoring for uptime and performance checks
  • Audit trail for tracking changes to configurations
  • Over 100 integrations with various tools
  • Pay-as-you-use pricing with data volume limits
  • 14-day free trial available

Pros:

  • Combines multiple observability aspects without separate tools
  • Helps detect issues faster through unified views
  • Predictable costs with no overage fees
  • Free trial lets users test without commitment

Cons:

  • Cloud-based only, no self-hosted option mentioned
  • Focus on volume limits might constrain heavy users
  • Requires setup for integrations to maximize value

Contact Information:

  • Website: sematext.com
  • Phone: +1 347-480-1610
  • Email: info@sematext.com
  • LinkedIn: www.linkedin.com/company/sematext-international-llc
  • Facebook: www.facebook.com/Sematext
  • Twitter: x.com/sematext

3. Splunk

Splunk functions as an AI-native platform for security and observability, ingesting logs, metrics, traces, and events from diverse sources like clouds or on-premises setups. It supports real-time insights and manages data lifecycles, with tools for threat detection, investigation, and response powered by AI. Monitoring covers environments, stacks, and networks, optimizing based on impact and reducing alert noise through correlation.

The system includes application performance monitoring and IT service intelligence for anomaly detection and proactive fixes. Deployment works across AWS, Azure, GCP, private clouds, or on-site, with over 2000 integrations via a marketplace. AI features enable natural language queries and workflow automation, focusing on troubleshooting and model building for operational data.

Key Highlights:

  • Ingests logs, metrics, traces from any source
  • AI for threat detection and response
  • Monitors across clouds and on-premises
  • Reduces alert noise with event correlation
  • Supports OpenTelemetry and agents
  • Marketplace with many integrations

Pros:

  • Handles complex, multi-source data unification
  • Speeds up detection and resolution with AI
  • Flexible deployment in various environments
  • Extensible with custom apps and add-ons

Cons:

  • Can feel overwhelming for simple log needs
  • No pricing transparency on the site
  • Heavy reliance on integrations for full coverage
  • AI features might require learning curve

Contact Information:

  • Website: www.splunk.com
  • Phone: 1 866.438.7758
  • Email: info@splunk.com
  • Address: 3098 Olsen Drive San Jose, California 95128
  • LinkedIn: www.linkedin.com/company/splunk
  • Facebook: www.facebook.com/splunk
  • Twitter: x.com/splunk
  • Instagram: www.instagram.com/splunk

Datadog

4. Datadog

Datadog delivers an observability and security platform that pulls in logs, metrics, traces, and events from pretty much any source. It covers infrastructure, applications, networks, databases, and serverless setups, with extras like real-time user monitoring, synthetic tests, and cloud cost tracking. The whole thing runs in the cloud and leans hard into AI for anomaly detection, alert noise reduction, and incident handling.

Users get a unified view across stacks, plus tools for workflow automation and bits of AI assistance. Deployment stays fully hosted, with a marketplace for integrations and add-ons. Pricing details stay behind a contact form, though a limited free tier exists for basic use.

Key Highlights:

  • Handles logs, metrics, traces, and events in one place
  • Includes synthetic monitoring and real user monitoring
  • Offers cloud cost management features
  • Provides AI-driven insights and incident tools
  • Supports OpenTelemetry natively
  • Marketplace for extensions and integrations

Pros:

  • Covers a wide range of monitoring needs without separate tools
  • Strong integration library saves setup time
  • AI features help cut through alert fatigue
  • Works across cloud and on-premises environments

Cons:

  • Pricing requires direct contact for details
  • Can get complex when enabling many features
  • Heavy use might push costs up quickly
  • Learning curve for less experienced users

Contact Information:

  • Website: www.datadoghq.com
  • Phone: 866 329-4466
  • Email: info@datadoghq.com
  • Address: 620 8th Ave 45th Floor, New York, NY 10018
  • LinkedIn: www.linkedin.com/company/datadog
  • Twitter: x.com/datadoghq
  • Instagram: www.instagram.com/datadoghq
  • App Store: apps.apple.com/app/datadog/id1391380318
  • Google Play: play.google.com/store/apps/details?id=com.datadog.app

5. Grafana

Grafana centers around visualization and brings metrics, logs, traces, and profiles together into dashboards. Grafana Cloud handles the hosting part, while the open-source version lets users run it themselves. It connects to hundreds of data sources and includes managed backends like Mimir for metrics, Loki for logs, and Tempo for traces.

The cloud offering comes with a generous free tier that covers decent amounts of data and includes enterprise plugins. Paid plans unlock higher limits and extra features like incident management and on-call tools. Users often pair it with Prometheus or OpenTelemetry setups.

Key Highlights:

  • Dashboards for metrics, logs, traces, and profiles
  • Managed backends in the cloud version
  • Free tier with solid data allowances
  • Synthetic monitoring and performance testing options
  • Incident response and alerting tools
  • Works with Prometheus, OpenTelemetry, and many others

Pros:

  • Flexible visualization that fits most data sources
  • Free tier works well for smaller setups
  • Open-source core gives deployment choices
  • Easy to extend with plugins

Cons:

  • Users usually need separate storage backends
  • Full observability requires combining multiple components
  • Advanced features move to paid plans
  • Dashboard creation takes some practice

Contact Information:

  • Website: grafana.com
  • Email: info@grafana.com
  • LinkedIn: www.linkedin.com/company/grafana-labs
  • Facebook: www.facebook.com/grafana
  • Twitter: x.com/grafana

6. Papertrail

Papertrail offers cloud-hosted log management that gathers syslog and text logs from servers, apps, and devices into one searchable place. It provides real-time tailing, search across archives, and basic alerting on patterns. Setup usually takes minutes since it accepts logs over standard protocols.

A free plan handles small volumes with limited retention, while paid plans start low and scale with usage. The 30-day trial gives full access to paid features. It works well as a lightweight addition to existing tools rather than a complete observability suite.

Key Highlights:

  • Cloud-based syslog and text log aggregation
  • Real-time search and tailing
  • Basic pattern-based alerts
  • Archives with longer retention on paid plans
  • Free plan for low-volume use
  • 30-day full-featured trial

Pros:

  • Quick to set up and start sending logs
  • Simple interface for everyday searches
  • Free tier covers basic needs
  • Works with existing syslog setups

Cons:

  • Limited to logs only, no metrics or traces
  • Advanced analysis stays basic
  • Retention and volume caps on lower plans
  • Owned by SolarWinds, which carries past baggage

Contact Information:

  • Website: www.papertrail.com
  • Phone: +1-866-530-8040
  • Email: sales@solarwinds.com
  • Address: 7171 Southwest Parkway Bldg 400 Austin, Texas 78735
  • LinkedIn: www.linkedin.com/company/solarwinds
  • Facebook: www.facebook.com/SolarWinds
  • Twitter: x.com/papertrailapp
  • Instagram: www.instagram.com/solarwindsinc

7. Loggly

Loggly runs as a cloud-hosted service that pulls in logs from pretty much any source without needing special agents. It handles everything from aggregation to fast search across large volumes, with built-in parsing that breaks events into fields for easier querying. Users get dashboards, charts, and alerts based on patterns or thresholds, all through a web interface that keeps things straightforward.

The platform stays fully managed in the cloud, so no servers to run. A free trial lets people test the full setup before picking a paid plan, which scales with log volume and retention needs. It works well for teams already sending syslog or text logs and wanting quick visibility without much setup fuss.

Key Highlights:

  • Accepts logs from dozens of sources without agents
  • Fast search and automatic event parsing
  • Built-in dashboards and charting
  • Pattern-based alerts
  • Fully cloud-hosted
  • Free trial available

Pros:

  • Gets up and running fast
  • Handles high volumes without local storage worries
  • Simple sharing of saved searches and dashboards
  • Good for basic log consolidation

Cons:

  • Retention and volume limits depend on plan
  • Advanced analytics stay fairly basic
  • No on-premises option
  • Part of SolarWinds family

Contact Information:

  • Website: www.loggly.com
  • LinkedIn: www.linkedin.com/company/loggly
  • Twitter: x.com/loggly

8. Logmanager

Logmanager offers a platform that combines log management with SIEM capabilities in one interface. It started as an in-house fix for complicated tools and grew into a product that handles collection, storage, analysis, and security event monitoring. Deployment can be on-premises or in the cloud, depending on what users prefer.

The system focuses on keeping things simple while covering compliance reports, correlation rules, and long-term archiving. Pricing stays behind a contact form, but a demo or trial is usually available. It suits environments that need both operational logs and security oversight without juggling separate tools.

Key Highlights:

  • Combines log management and SIEM features
  • On-premises or cloud deployment
  • Built-in compliance reporting
  • Event correlation rules
  • Long-term log archiving
  • Single interface for everything

Pros:

  • Reduces tool sprawl for ops and security
  • Flexible deployment choices
  • Straightforward interface for daily use
  • Covers regulatory needs out of the box

Cons:

  • Smaller community compared to open-source options
  • Pricing details require contact
  • Less public documentation
  • Might feel niche outside Europe

Contact Information:

  • Website: logmanager.com
  • Email: support@logmanager.com
  • Address: Zubateho 295/5, 150 00 Praha 5
  • LinkedIn: www.linkedin.com/company/logmanager

9. Elastic

Elastic builds on Elasticsearch, Kibana, Beats, and Logstash to create a full search and analytics stack. People use it for logging, metrics, security events, or any data that needs fast search and visualization. The core stays open source, while Elastic Cloud offers a managed version with extra features like machine learning and security tools.

Users can run it themselves or let Elastic host everything. A free trial exists for the cloud service, and the self-hosted path costs nothing for basic use. It scales from small setups to huge clusters and works with almost any data format.

Key Highlights:

  • Elasticsearch for storage and search
  • Kibana for dashboards and visualization
  • Beats and Logstash for data collection
  • Machine learning and security features available
  • Self-hosted or managed cloud
  • Free core with paid add-ons

Pros:

  • Extremely flexible for any data type
  • Huge ecosystem and community
  • Powerful full-text search
  • Scales horizontally with ease

Cons:

  • Self-hosted version needs tuning and upkeep
  • Resource-heavy on large clusters
  • Paid features locked behind license
  • Steep learning curve for advanced use

Contact Information:

  • Website: www.elastic.co
  • LinkedIn: www.linkedin.com/company/elastic-co
  • Facebook: www.facebook.com/elastic.co
  • Twitter: x.com/elastic

10. Fluentd

Fluentd acts as an open-source log collector that sits between data sources and storage backends. It uses a plugin system to connect hundreds of inputs and outputs, keeping the core light while handling buffering, routing, and basic parsing. Companies run it on servers or in containers to forward logs to places like Elasticsearch, S3, or databases.

Everything stays free under Apache license, and the project lives under CNCF. Configuration happens through text files, and reliability comes from built-in retry and buffer options. It fits well in Kubernetes or any setup that already uses multiple logging tools.

Key Highlights:

  • Unified logging layer with plugins
  • Buffering and retry mechanisms
  • Lightweight core footprint
  • Works with containers and servers
  • Fully open source
  • CNCF graduated project

Pros:

  • No licensing cost ever
  • Connects almost anything to anything
  • Reliable delivery with buffers
  • Active plugin ecosystem

Cons:

  • Only collects and forwards, no built-in search
  • Configuration can get messy at scale
  • Needs separate storage and UI
  • Debugging plugin issues takes time

Contact Information:

  • Website: www.fluentd.org
  • Facebook: www.facebook.com/pages/Fluentd/196064987183037
  • Twitter: x.com/fluentd

11. Logz.io

Logz.io runs a cloud observability platform built on top of open-source tools like ELK and Grafana, but fully managed. It pulls together logs, metrics, and traces into one place, adds some AI for root cause suggestions and automated insights, and keeps the interface familiar to anyone who has used Kibana before. Users drop in their data, and the system handles scaling, updates, and storage without much hands-on work.

The service stays completely hosted, with a free trial that gives full access for a limited period. Paid plans scale by ingested volume and retention length. It works for teams that like the open-source stack but do not want to run clusters themselves.

Key Highlights:

  • Managed ELK and Grafana stack
  • Combines logs, metrics, and traces
  • AI-driven issue suggestions
  • Cloud-only deployment
  • Familiar Kibana-style interface
  • Free trial available

Pros:

  • No need to manage Elasticsearch clusters
  • Keeps the open-source feel with less ops work
  • Unified view across telemetry types
  • Easy migration path from self-hosted ELK

Cons:

  • Still tied to Elasticsearch pricing curves at large scale
  • Less control than running it yourself
  • AI features limited to higher plans
  • Cloud-only, no on-prem option

Contact Information:

  • Website: logz.io
  • Email: sales@logz.io
  • Address: 77 Sleeper St, Boston, MA 02210, USA
  • LinkedIn: www.linkedin.com/company/logz-io
  • Twitter: x.com/logzio

12. OpenObserve

OpenObserve delivers an open-source observability platform designed from scratch for logs, metrics, traces, and profiles. It focuses on keeping storage costs low while still offering fast search and dashboards, using a columnar format and object storage under the hood. Users can run it on Kubernetes or bare metal, or use the managed cloud version.

Everything stays free for self-hosted use, while the cloud edition has a free tier and paid plans based on usage. The project moves fast and targets teams that find traditional ELK setups too heavy or expensive.

Key Highlights:

  • Handles logs, traces, metrics, and profiles
  • Columnar storage for lower costs
  • Self-hosted or managed cloud
  • Open-source core
  • Built-in dashboarding
  • Free tier in cloud version

Pros:

  • Much cheaper storage than Elasticsearch-based tools
  • Single binary or container deployment
  • Good performance on object storage
  • No vendor lock-in on self-hosted

Cons:

  • Younger project, smaller community
  • Fewer third-party integrations so far
  • Some features still catching up
  • Documentation can lag behind releases

Contact Information:

  • Website: openobserve.ai
  • Address: 3000 Sand Hill Rd Building 1, Suite 260, Menlo Park, CA 94025
  • LinkedIn: www.linkedin.com/company/openobserve
  • Twitter: x.com/OpenObserve

13. Exabeam

Exabeam concentrates on security analytics and SIEM replacement with heavy use of behavioral modeling. It ingests logs, builds user and entity baselines, then flags deviations with AI-driven risk scoring. The platform also automates parts of investigation and response workflows.

Deployment happens in the cloud as a managed service. Pricing and trials require a demo request. It fits environments that already have basic log collection and want the next layer of threat detection on top.

Key Highlights:

  • Behavioral UEBA analytics
  • Automated investigation workflows
  • Risk scoring for users and devices
  • Cloud-hosted SIEM alternative
  • Insider threat focus
  • Timeline-based case view

Pros:

  • Strong on user and entity behavior
  • Cuts down alert fatigue with scoring
  • Automates routine investigation steps
  • Clean incident timelines

Cons:

  • Needs decent log ingestion to build baselines
  • Not a general-purpose log management tool
  • Pricing stays opaque without sales contact
  • Less flexible for non-security use cases

Contact Information:

  • Website: www.exabeam.com
  • Phone: 1.844.392.2326
  • Email: info@exabeam.com
  • Address: 385 Interlocken Crescent Suite 1050 Broomfield, CO 80021
  • LinkedIn: www.linkedin.com/company/exabeam
  • Twitter: x.com/exabeam
  • Instagram: www.instagram.com/exabeam

14. DNIF HYPERCLOUD

DNIF HYPERCLOUD works as a cloud SIEM and log platform that tries to keep costs predictable even with high volumes. It stores data in a way that avoids rehydration delays and offers instant access to older events. The system links related alerts into threat campaigns and includes user behavior analytics.

Everything runs managed in the cloud. Access starts after contacting sales for a demo or trial. It appeals to organizations frustrated with traditional SIEM pricing at scale.

Key Highlights:

  • Flat storage approach for long retention
  • No rehydration waits for old data
  • Threat campaign correlation
  • User behavior analytics
  • Cloud-only deployment
  • Automation for SOC workflows

Pros:

  • Keeps older data instantly searchable
  • Lower cost per ingested volume
  • Groups alerts into campaigns
  • Reduces manual correlation work

Cons:

  • Smaller footprint outside certain regions
  • Requires sales contact for any details
  • Less known compared to bigger players
  • Limited public integration list

Contact Information:

  • Website: dnif.it
  • Address: NETMONASTERY Systems Inc, Mountain View, California, USA

15. Corner Bowl Server Manager

Corner Bowl Server Manager comes as Windows-focused software that mixes log management, SIEM functions, and basic server monitoring in one package. It collects logs from Windows, Linux, Azure, and some network devices, either with agents or without, and keeps them for compliance checks like PCI, NIST, or GDPR. Users also get resource monitoring for CPU, disk space, services, and a few built-in intrusion detection rules.

Installation happens on-premises on a Windows server, and licensing works per monitored host or device. A free trial runs fully featured for a set period. It tends to show up in smaller or mid-sized setups that already run a lot of Windows and want one tool instead of several separate ones.

Key Highlights:

  • Windows and Linux log collection with or without agents
  • Built-in compliance templates for common standards
  • Resource and service monitoring included
  • Basic intrusion detection rules
  • On-premises Windows installation
  • Free trial available

Pros:

  • Covers logs and basic monitoring in one license
  • Simple setup for Windows-heavy environments
  • Direct Event Log batch import for audits
  • No cloud dependency

Cons:

  • Interface feels dated compared to modern tools
  • Limited scalability for very large environments
  • Mostly Windows-centric feature set
  • Documentation stays fairly basic

Contact Information:

  • Website: www.cornerbowlsoftware.com
  • Phone: 801-910-4256
  • Email: info@CornerBowlSoftware.com
  • Address: 982 Splendor Valley Rd Kamas UT, 84036 USA
  • LinkedIn: www.linkedin.com/company/corner-bowl-software
  • Twitter: x.com/BowlCorner

16. Securonix

Securonix delivers a cloud-native SIEM that bundles UEBA, SOAR functions, and threat intelligence into a single platform. It leans on agentic AI to cut false positives, automate investigations, and link related alerts together. Data stays hot and searchable for a full year without extra rehydration steps, and reporting targets compliance needs like SEC or GDPR.

Everything runs managed in the cloud with pricing based on data volume and features. Access starts after a demo and sales conversation. It fits organizations that already deal with tool sprawl and want one system for detection through response.

Key Highlights:

  • Combines SIEM, UEBA, and SOAR in one cloud platform
  • Agentic AI for alert handling and automation
  • Year-long hot data access
  • Built-in compliance reporting
  • Cloud-native deployment
  • Threat intelligence integration

Pros:

  • Reduces need for separate security tools
  • Automation lowers daily analyst workload
  • Keeps older data instantly available
  • Single pane for investigation and response

Cons:

  • Pricing and contracts require sales contact
  • Heavy reliance on cloud connectivity
  • Best value appears at larger data volumes
  • Learning curve for the AI-driven workflows

Contact Information:

  • Website: www.securonix.com
  • Email: info@securonix.com
  • Address: 400 Concar Dr, San Mateo, CA 94402
  • LinkedIn: www.linkedin.com/company/securonix
  • Twitter: x.com/Securonix


Wrapping It Up

At the end of the day, swapping out Graylog usually comes down to one simple question: what’s the thing that annoys you the most right now? Is it the constant Elasticsearch tuning, the surprise invoices, the pipeline syntax that feels like writing assembly, or just the fact that you’re still running a cluster in 2026?

Whatever it is, something on this list solves exactly that itch without forcing you into a whole new set of problems. Some options are basically “set it and forget it” clouds, others are “here’s the repo, good luck,” and a few sit in that sweet middle where you get modern features without selling your soul to a vendor.

Try a couple, break them a little on purpose, see which one doesn’t make you want to throw your laptop out the window. When you finally land on the one that just works, you’ll wonder why you waited this long. Logs shouldn’t feel like a second job.


Best AppDynamics Alternatives: Less Bloat, More Velocity in 2026

If you’re staring at yet another AppDynamics bill and wondering why “enterprise-grade” has to mean “enterprise-pain-in-the-ass,” It’s powerful, sure, but the licensing headaches, the agent sprawl, the endless console tours just to find one metric it starts to feel like you’re maintaining a monitoring platform instead of your actual product.

Good news: the market is stacked with legit alternatives from top companies that get it. Tools that spin up in minutes, cost a fraction, and still give you the tracing, alerting, and dashboards you need-without forcing you to hire a full-time “monitoring whisperer.”

Below are the standouts we’d actually use (and a bunch of our teams already have). No fluff, no forced rankings, just the options that let you get back to building instead of babysitting another ops tool. Let’s go.

1. AppFirst

AppFirst flips the usual infra problem on its head: instead of writing Terraform, YAML, or wrestling with cloud consoles, developers just declare what their app needs – CPU, memory, database type, networking rules – and the platform builds the secure, compliant infrastructure automatically across AWS, Azure, or GCP. Everything gets provisioned in minutes with built-in logging, monitoring, alerting, and cost tracking per app.

It comes as SaaS or self-hosted, so companies that want to keep things in-house can. The whole point is to let developers own the full lifecycle without waiting on a separate DevOps crew.

Key Highlights:

  • Declare app requirements, get full infra auto-provisioned
  • Built-in observability, security, and cost visibility
  • Works on any major cloud or self-hosted
  • No Terraform or cloud-specific knowledge needed

Pros:

  • Removes infra code and PR reviews completely
  • Instant environments for every branch or ticket
  • Real cost breakdown per application

Cons:

  • Still early, so some niche cloud services missing
  • You trade full manual control for speed

Contact Information:

Datadog

2. Datadog

Datadog runs as a SaaS platform that pulls together infrastructure monitoring, application performance monitoring, log management, real-user monitoring, and a bunch of other observability pieces into one place. The idea is to give everyone – devs, ops, security, even business folks – a single pane of glass for whatever is happening across the stack, whether it is on-prem, cloud, or a mix.

People use it to spot issues faster, secure applications and infrastructure, understand how users actually behave, and keep an eye on business metrics that matter. It works for small setups and large ones alike.

Key Highlights:

  • Full-stack observability in one SaaS product
  • Infrastructure, APM, logs, real-user monitoring, synthetics
  • Heavy focus on real-time dashboards and alerts
  • Works across clouds and on-prem

Pros:

  • Very tight integrations and turnkey dashboards
  • Fast setup for common tech stacks
  • Strong tracing and profiling capabilities

Cons:

  • Costs can climb quickly when you turn on all the modules
  • Some users find the UI a bit crowded once you have lots of data

Contact Information:

  • Website: www.datadoghq.com
  • Phone: 866 329-4466
  • Email: info@datadoghq.com
  • Address: 620 8th Ave 45th Floor, New York, NY 10018
  • LinkedIn: www.linkedin.com/company/datadog
  • Twitter: x.com/datadoghq
  • Instagram: www.instagram.com/datadoghq
  • App Store: apps.apple.com/app/datadog/id1391380318
  • Google Play: play.google.com/store/apps/details?id=com.datadog.app

3. Dynatrace

Dynatrace positions itself as an AI-heavy observability platform that tries to automate as much as possible. It watches applications, infrastructure, user experience, security signals, logs, and even generative AI workloads, then uses its Davis AI engine to connect the dots and suggest or take actions.

The platform automatically maps dependencies, spots anomalies, and attempts to explain root causes without much manual configuration. It covers cloud platforms, Kubernetes, serverless, and traditional environments.

Key Highlights:

  • Automatic topology discovery and dependency mapping
  • Built-in AI for causation and anomaly detection
  • Covers application security and runtime vulnerability analysis
  • Supports observability for LLMs and AI agents

Pros:

  • Very little manual setup needed
  • Strong automation and remediation suggestions
  • Good at handling dynamic cloud-native environments

Cons:

  • Pricing is usage-based and can feel opaque
  • Less flexible when you want to heavily customize dashboards or queries

Contact Information:

  • Website: www.dynatrace.com
  • Phone: +1.650.436.6700
  • Email: sales@dynatrace.com
  • Address: 401 Castro Street, Second Floor Mountain View, CA, 94041 United States of America
  • LinkedIn: www.linkedin.com/company/dynatrace
  • Facebook: www.facebook.com/Dynatrace
  • Twitter: x.com/Dynatrace
  • Instagram: www.instagram.com/dynatrace

4. New Relic

New Relic delivers an observability platform that tries to cover the entire stack from infrastructure to application code to front-end user experience. Everything lives under one account and one data store, so queries and dashboards can pull from any part of the system without stitching things together manually.

It includes the usual metrics, events, logs, and traces, plus extras like synthetics, browser monitoring, and some business KPI tracking.

Key Highlights:

  • Single data platform for all telemetry types
  • Instant setup for many languages and frameworks
  • Includes browser and mobile monitoring out of the box
  • Free tier available with generous limits

Pros:

  • Easy to get started and add new services
  • Very developer-friendly query language (NRQL)
  • Pricing recently shifted to be more consumption-based

Cons:

  • Ingest-based pricing can still surprise you at scale
  • Some advanced features live behind higher plans

Contact Information:

  • Website: newrelic.com
  • Phone: (415) 660-9701
  • Address: 1100 Peachtree St NE, Atlanta, GA 30309
  • LinkedIn: www.linkedin.com/company/new-relic-inc-
  • Facebook: www.facebook.com/NewRelic
  • Twitter: x.com/newrelic
  • Instagram: www.instagram.com/newrelic

5. ManageEngine Applications Manager

ManageEngine Applications Manager is an application performance monitoring and observability tool that runs either on-prem or in your own data center or as a hosted instance. It monitors applications, servers, databases, clouds, and websites, with support for Java, .NET, Node.js, Python, PHP, Ruby, and a long list of other technologies.

It gives code-level diagnostics, distributed tracing, synthetic transactions from real browsers, and service maps. The tool also watches multi-cloud resources and virtualization platforms.

Key Highlights:

  • Deep code-level visibility and transaction tracing
  • Agentless database and server monitoring
  • Synthetic web transaction monitoring with Selenium scripts
  • Works on-premise or hosted

Pros:

  • Runs completely inside your network if you want
  • Broad technology coverage without extra agents
  • Straightforward licensing model

Cons:

  • UI feels a generation behind fully cloud-native tools
  • Setup and upgrades require more manual steps than pure SaaS options

Contact Information:

  • Website: www.manageengine.com
  • Phone: +1 408 916 9696
  • Email: pr@manageengine.com
  • Address: 4141 Hacienda Drive Pleasanton CA 94588 USA
  • LinkedIn: www.linkedin.com/company/manageengine
  • Facebook: www.facebook.com/ManageEngine
  • Twitter: x.com/manageengine
  • Instagram: www.instagram.com/manageengine

6. SolarWinds

SolarWinds builds a range of IT management and monitoring tools, with a big chunk focused on observability, infrastructure, databases, and service management. Most products install on-premise or in private clouds, though some lighter pieces live in their SaaS offering. The platform leans heavily on discovering everything in the environment automatically and then giving admins dashboards, alerts, and basic AI-driven suggestions.

A lot of the tooling grew up in the era of physical servers and traditional networks, so it still feels comfortable for teams running mixed or legacy environments. Recent versions added more cloud coverage and incident-response workflows.

Key Highlights:

  • Strong network and server discovery
  • Database performance monitoring included
  • IT service management and incident workflows
  • Mix of on-prem and SaaS deployment options

Pros:

  • Very good at traditional data-center visibility
  • One-time license model available for some products
  • Familiar interface for long-time users

Cons:

  • Some components still feel dated compared to pure cloud tools
  • Upgrades and patching can be manual and slow

Contact Information:

  • Website: www.solarwinds.com
  • Phone: +1-866-530-8040
  • Email: sales@solarwinds.com
  • Address: 7171 Southwest Parkway Bldg 400 Austin, Texas 78735
  • LinkedIn: www.linkedin.com/company/solarwinds
  • Facebook: www.facebook.com/SolarWinds
  • Twitter: x.com/solarwinds
  • Instagram: www.instagram.com/solarwindsinc

7. Splunk

Splunk started as a log-management powerhouse and has grown into a broader data platform that handles security, observability, and custom analytics. After joining forces with Cisco, the focus shifted toward combining network, endpoint, and application data on one backend. Most customers run the cloud version now, but on-prem and hybrid setups still exist.

People feed it logs, metrics, traces, or pretty much any machine data, then search, dashboard, and alert on it. The search language is famously flexible once you get used to it.

Key Highlights:

  • Search-driven approach to any machine data
  • Heavy use in security and operations centers
  • Real-time streaming and large-scale indexing
  • Cloud, on-prem, or hybrid deployment

Pros:

  • Extremely powerful when you master the query language
  • Huge library of add-ons and integrations
  • Good at handling raw, unstructured data

Cons:

  • Storage and compute costs add up fast at scale
  • Learning curve can be steep for new users

Contact Information:

  • Website: www.splunk.com
  • Phone: 1 866.438.7758
  • Email: info@splunk.com
  • Address: 3098 Olsen Drive San Jose, California 95128
  • LinkedIn: www.linkedin.com/company/splunk
  • Facebook: www.facebook.com/splunk
  • Twitter: x.com/splunk
  • Instagram: www.instagram.com/splunk

grafana

8. Grafana

Grafana is mostly known for its open-source dashboard front-end, but the company also maintains several backends. Tempo is their distributed-tracing solution that only needs object storage (S3, GCS, Azure Blob) to run. It skips traditional indexing to keep costs down and works natively with Jaeger, Zipkin, and OpenTelemetry formats.

Most users run Tempo alongside Prometheus for metrics and Loki for logs, all visualized in Grafana dashboards. You can self-host everything or use Grafana Cloud, which includes hosted Tempo instances.

Key Highlights:

  • Tracing backend that only requires object storage
  • No indexing of trace contents
  • Tight integration with Prometheus, Loki, and Grafana UI
  • Fully open-source core (AGPLv3)

Pros:

  • Very low storage cost compared to indexed tracing systems
  • Simple operations – just point it at a bucket
  • Easy to drop into existing Grafana setups

Cons:

  • Finding specific traces relies on trace ID or tags stored elsewhere
  • Fewer built-in analytics than heavily indexed competitors

Contact Information:

  • Website: grafana.com
  • Email: info@grafana.com
  • LinkedIn: www.linkedin.com/company/grafana-labs
  • Facebook: www.facebook.com/grafana
  • Twitter: x.com/grafana

9. Elastic Observability

Elastic Observability sits on top of the Elasticsearch and pushes a unified approach where logs, metrics, traces, and synthetics all land in the same place. Everything follows OpenTelemetry standards from the start, so you can send native OTel data without extra agents or vendor extensions. The platform leans hard into search-driven exploration and lately added agentic AI features that try to summarize issues or suggest next steps.

Most deployments run in Elastic Cloud, but self-managed clusters still work fine. People who already use the ELK stack for logging usually find the jump to full observability pretty smooth.

Key Highlights:

  • Single backend for logs, metrics, traces, and profiles
  • Native OpenTelemetry ingestion without proprietary changes
  • Heavy search and AI-assisted analysis
  • Prebuilt dashboards and anomaly detection included

Pros:

  • Extremely fast log and trace search even on large volumes
  • No separate agents needed for basic OTel data
  • Easy to extend with custom machine-learning jobs

Cons:

  • Costs grow with ingested volume and retention
  • Some traditional APM features feel bolted on compared to pure-play tools

Contact Information:

  • Website: www.elastic.co
  • Email: info@elastic.co
  • Address: Keizersgracht 281 1016 ED Amsterdam
  • LinkedIn: www.linkedin.com/company/elastic-co
  • Facebook: www.facebook.com/elastic.co
  • Twitter: x.com/elastic

10. LogicMonitor

LogicMonitor is a SaaS monitoring platform that watches infrastructure, clouds, containers, applications, and networks from one place. It ships with a large collection of pre-made collectors and integrations, so most devices and services get discovered and monitored automatically after you drop in the agent or enable cloud connectors.

The newer Edwin AI piece tries to cut down alert noise and group related incidents. Deployment stays fully cloud-hosted on their side.

Key Highlights:

  • Broad out-of-box coverage for hardware, cloud, and apps
  • Automatic discovery and topology mapping
  • Built-in AIOps for alert deduplication
  • Collector-based or agentless options

Pros:

  • Quick to cover a mixed environment
  • Clean topology views update themselves
  • Forecasting and capacity planning built in

Cons:

  • Pricing scales with the number of monitored resources
  • Deep application code visibility requires extra modules

Contact Information:

  • Website: www.logicmonitor.com
  • Phone: 888 415 6442
  • Email: sales@logicmonitor.com
  • Address: 98 San Jacinto Blvd Suite 1300 Austin, TX 78701 USA
  • LinkedIn: www.linkedin.com/company/logicmonitor
  • Facebook: www.facebook.com/LogicMonitor
  • Twitter: x.com/LogicMonitor
  • Instagram: www.instagram.com/logicmonitor

11. Edge Delta

Edge Delta takes a different angle – it pushes analysis as close to the data source as possible. Lightweight agents stream data before it ever hits central storage, running anomaly detection, parsing, and even some remediation steps right there on the host or in the pipeline. Only the digested or flagged data gets forwarded, which keeps central costs down.

Users can build or tweak their own AI agents with custom prompts and connect them to Slack, PagerDuty, or ticketing systems. Everything stays streaming-focused.

Key Highlights:

  • Processing and AI analysis at the edge
  • Configurable AI agents for SRE and security tasks
  • Streaming pipeline with minimal central storage
  • Free sign-up tier available

Pros:

  • Dramatically lower data transfer and storage bills
  • Very fast feedback loop when something looks odd
  • Easy to create custom automation agents

Cons:

  • You give up some historical depth unless you forward raw data too
  • Still newer, so fewer battle-tested integrations than older platforms

Contact Information:

  • Website: edgedelta.com
  • LinkedIn: www.linkedin.com/company/edgedelta
  • Twitter: x.com/edge_delta

12. eG Innovations

eG Innovations delivers monitoring that focuses on user experience and root-cause diagnosis across on-prem, cloud, and hybrid setups. A single agent correlates activity from virtual desktops, applications, databases, storage, all the way to the underlying infrastructure. The patented correlation engine tries to pinpoint why something feels slow instead of just showing that it is slow.

It works well for Citrix, VMware Horizon, and classic enterprise apps, alongside newer cloud workloads. Deployment can be on-prem or SaaS.

Key Highlights:

  • Strong correlation across tiers (VDI, app, DB, storage)
  • Automatic root-cause diagnosis engine
  • Single agent for end-to-end visibility
  • Good coverage of legacy and virtual-desktop environments

Pros:

  • Very good at complex Citrix/VDI troubleshooting
  • One console for user experience down to hardware
  • Clear “why” answers when things degrade

Cons:

  • Interface looks older than most cloud-native tools
  • Less emphasis on modern distributed tracing compared to others

Contact Information:

  • Website: www.eginnovations.com
  • Phone: +1 (866) 526 6700
  • Address: 33 Wood Ave. South, Suite 600, Iselin, NJ 08830, USA
  • LinkedIn: www.linkedin.com/company/eg-innovations
  • Facebook: www.facebook.com/eGInnovations
  • Twitter: x.com/eginnovations

13. Sematext

Sematext runs a cloud observability platform that bundles logs, metrics, traces, synthetics, and some front-end monitoring in one package. You get pre-built dashboards for most common stacks right away, and the whole thing stays focused on keeping setup simple and costs predictable. Most users go with the hosted version, though self-hosted agents are still an option if you want.

The pricing model lets you mix and match features and retention without too many surprises, and support answers fast even on lower plans. It works fine for smaller setups or when you don’t want to juggle separate tools.

Key Highlights:

  • Logs, metrics, traces, and synthetics in one service
  • Ready-made dashboards for popular technologies
  • Flexible retention and plan mixing
  • 14-day free trial, no credit card needed

Pros:

  • Very quick to spin up monitoring for new services
  • Transparent usage-based pricing
  • Solid alerting and anomaly detection out of the box

Cons:

  • Less depth in code-level profiling than some dedicated APM tools
  • UI can feel a bit busy when you have many apps

Contact Information:

  • Website: sematext.com
  • Phone: +1 347-480-1610
  • Email: info@sematext.com
  • LinkedIn: www.linkedin.com/company/sematext-international-llc
  • Facebook: www.facebook.com/Sematext
  • Twitter: x.com/sematext

14. Scout APM

Scout APM keeps things lightweight and developer-focused, mainly watching Ruby, Python, PHP, Node.js, and a few other languages. It hooks into the app with just a gem or package, then shows transaction traces, slow database queries, memory bloat, and N+1 issues without much noise. Lately they added tight integration with local AI coding assistants through MCP.

Errors, logs, and traces all land in the same view, so jumping between tools is rare. Pricing stays per-app and fairly flat.

Key Highlights:

  • Code-level tracing with almost no config
  • Automatic N+1 and slow-query detection
  • Built-in error tracking and log linking
  • Works with AI coding assistants locally

Pros:

  • Super low overhead on the app
  • Clean, focused interface
  • Easy to understand pricing

Cons:

  • Limited language support compared to bigger platforms
  • No infrastructure or host metrics included

Contact Information:

  • Website: www.scoutapm.com
  • Email: support@scoutapm.com
  • LinkedIn: www.linkedin.com/company/scout
  • Facebook: www.facebook.com/ScoutAPM
  • Twitter: x.com/ScoutAPM

15. Glassbox

Glassbox records actual user sessions on web and mobile, then layers analytics on top to spot struggle points, errors, and journey drop-offs. It captures clicks, scrolls, rage clicks, and form issues in real time and replays them exactly as the visitor saw them. Compliance-focused companies use the record-keeping part for audit trails.

It’s less about server-side performance and more about what the customer actually experiences, though some backend tagging is possible.

Key Highlights:

  • Full session replay with masking
  • Struggle and friction scoring
  • Mobile app analytics included
  • Digital record-keeping for compliance

Pros:

  • You literally see what users see
  • Strong privacy and masking controls
  • Great for conversion-rate troubleshooting

Cons:

  • Not a traditional APM or infra monitoring tool
  • Storage needs grow fast with traffic

Contact Information:

  • Website: www.glassbox.com
  • Phone: +1 646-397-5283
  • Address: 42 Broadway Suite 12-530 New York, 10004
  • LinkedIn: www.linkedin.com/company/glassbox-solutions
  • Facebook: www.facebook.com/Glassbox-103555754681679
  • Twitter: x.com/GlassboxDigita


Wrapping It Up

Ditching AppDynamics usually boils down to cost, overhead, or just being sick of the red tape. Good news: the alternatives now range from “declare your app and never touch Terraform again” to AI that actually tells you why things instead of screaming alerts, or pipelines that cut your ingest bill in half without throwing data away.

Pick two or three that catch your eye, run the trials on real services for a week, and you’ll feel immediately which one gets out of your way and lets you ship. Do that, and your next on-call will finally be quiet.


Argo CD Alternatives for Teams That Want a Different GitOps Flow

GitOps sounds neat until you’re knee-deep in pipelines that don’t behave the way you expect. Argo CD solves a lot of that for many teams, but it’s not the only option anymore. There’s a whole wave of companies building tools that handle deployments, automate the dull parts, and give you a clearer view of what’s actually happening inside your clusters.

This overview walks through platforms that step into the same space but take their own approach. Some keep things lightweight. Some offer more guardrails. Some simply try to save you from staring at dashboards all day. The point is to help you see what else is out there and decide which style of GitOps fits how you already work instead of forcing you into a shape that never quite matched.

1. AppFirst

AppFirst takes a pretty different angle compared to most tools you’d put next to Argo CD. Instead of focusing on syncing manifests or managing clusters, they go straight for the part developers usually dread the most: all the infrastructure setup that has to happen before an app ever ships. Their whole idea is that teams shouldn’t have to write Terraform, troubleshoot YAML, or learn the quirks of three different cloud providers just to get an app running. You tell AppFirst what the app actually needs, and the platform fills in the rest with ready to use infrastructure that follows the usual security and compliance rules.

They position themselves as an option for teams that want the benefits of automation without the overhead of running their own platform engineering stack. Logging, monitoring, networking, databases, identity, all that stuff gets wired up in the background. It feels closer to a platform layer that sits above the cloud rather than a GitOps controller, but it still fits into the Argo CD alternatives list because it removes the need for most infra pipelines entirely. For teams that want to ship fast without building a whole toolchain first, AppFirst ends up being a pretty practical direction.

Key Highlights:

  • Application first workflow that avoids Terraform, CDK, and YAML
  • Handles provisioning across AWS, Azure, and GCP
  • Built in logging, monitoring, and alerting
  • Central auditing and cost visibility per app
  • Fits teams that want to move quickly without homegrown infra tooling
  • Supports both SaaS and self hosted deployment

Services:

  • Automatic provisioning of compute, databases, and messaging systems
  • Networking, IAM, and secret setup based on app requirements
  • Infrastructure wide logging and monitoring
  • Compliance aligned configuration by default
  • App centric cost tracking and audit logs
  • Platform hosting with managed or self hosted options

Contact Info:

2. FluxCD

FluxCD shows up a lot in conversations about Argo CD alternatives because it tackles the same core problem: keeping Kubernetes deployments predictable without making engineers babysit every update. The project leans on Git as the single place where changes start, so whatever gets deployed is always tied back to a commit. Teams use Flux when they want a GitOps flow that stays hands-off, keeps clusters aligned with what is written in the repo, and quietly fixes drift when something changes behind the scenes.

Flux also fits well when a team wants flexibility in how they structure their pipeline. It works with the usual Git providers, container registries, CI tools, and policy systems without forcing a new stack. On top of basic continuous delivery, it includes features for progressive rollouts, multi-cluster setups, and managing both apps and infrastructure under one workflow. Many teams look at it as a close alternative to Argo CD, just with a different feel and a bit more emphasis on Kubernetes-native controllers.

Key Highlights:

  • Commonly used as a practical Argo CD alternative
  • Git as the source of truth for Kubernetes deployments
  • Automated syncing and drift correction built into the workflow
  • Supports canary releases and gradual rollouts through Flagger
  • Works with major Git providers, registries, and CI tools
  • Handles multi-cluster and multi-tenant setups

Services:

  • GitOps-focused continuous delivery tooling
  • Progressive delivery support for canaries and A/B changes
  • Automated container image update process
  • Integration with Helm, Kustomize, and OCI artifacts
  • Multi-cluster lifecycle and infrastructure management
  • Policy checks and notification integrations

Contact Information:

  • Website: fluxcd.io
  • Email: cncf-flux-dev+help@lists.cncf.io
  • Twitter: x.com/fluxcd

3. Spinnaker

Spinnaker comes up a lot when people look for Argo CD alternatives, mostly because it approaches continuous delivery from a slightly different angle. Instead of staying tightly focused on GitOps, they lean into pipeline style workflows that handle bigger, more complex release setups. Teams use it when they have apps running across several cloud providers or when deployments involve a mix of VM images, containers, and older systems that still need to stay in the loop. It gives them a way to manage all of that without scattering scripts everywhere.

They also put a lot of weight on keeping pipelines flexible. Spinnaker lets teams plug in automated tests, safety checks, approval steps, and rollout strategies without reinventing everything each time. It works with common CI tools and ties into cloud platforms so a deployment can roll out, pause, or roll back based on whatever conditions a team sets. For anyone who wants something less GitOps heavy but still wants structure, Spinnaker tends to feel like a practical alternative to Argo CD.

Key Highlights:

  • Often used by teams exploring non GitOps alternatives to Argo CD
  • Pipeline based approach for complex or multi cloud delivery
  • Supports automated rollout strategies like canary and blue/green
  • Works with common CI tools and cloud providers
  • Useful for teams mixing containers, VMs, and legacy workloads

Services:

  • Pipeline based continuous delivery setup
  • Deployment strategies including canary and blue/green
  • Integration with major cloud platforms
  • CI triggers and artifact handling
  • Monitoring and notification integration
  • Role based access controls and approval steps

Contact Information:

  • Website: spinnaker.io
  • Twitter: x.com/spinnakerio

jenkins

4. Jenkins X

Jenkins X often comes up when teams want something that feels a bit more automated and hands-off compared to Argo CD. Instead of expecting everyone to learn every detail of Kubernetes or Tekton, they try to handle most of that work in the background. The idea is pretty simple: you write code, push changes, and Jenkins X builds out the pipelines, handles the environments, and keeps things moving through GitOps without a lot of manual setup. It is especially useful for teams that want CI and CD wrapped together instead of juggling separate tools.

They also put a noticeable amount of effort into the developer workflow. Things like preview environments, pull request comments, and automatic promotion between environments make the whole process feel more connected to day-to-day development. It fits well as an Argo CD alternative when a team wants GitOps but also wants built-in CI, chat feedback, and a more guided workflow that does not require constant tweaking.

Key Highlights:

  • A common alternative to Argo CD for teams wanting CI and CD together
  • Automates Tekton pipelines without needing deep Kubernetes knowledge
  • Uses GitOps to manage environments and promotions
  • Creates preview environments for pull requests
  • Provides chat feedback on commits, issues, and pull requests

Services:

  • Automated CI and CD through Tekton pipelines
  • GitOps based environment management
  • Pull request preview environments
  • ChatOps for code and deployment feedback
  • Version upgrade automation
  • Community support and contributor resources

Contact Information:

  • Website: jenkins-x.io

5. Codefresh

Codefresh often shows up in the Argo CD alternatives list because they approach GitOps from a slightly different angle. Instead of trying to replace Argo CD, they build around it and fill in the parts that usually end up covered in custom scripts. Their focus is on the middle steps of the delivery flow, the part between a commit and a production rollout where teams usually test, promote, and double check everything. They try to make that whole stretch easier to manage so the workflow does not rely on a pile of one-off pipelines.

They also make it easier for platform teams to shape a full delivery lifecycle without starting from scratch. Codefresh lets teams map environments, define promotion rules, and manage several Argo CD instances without jumping between tools. Developers get a bit more clarity too, since they can follow releases without chasing down tickets or asking the platform team for updates. As an Argo CD alternative, they fit well for teams that want to keep Argo around but want more structure on top of it.

Key Highlights:

  • Often used by teams looking for an Argo CD alternative with added workflow support
  • Helps replace custom scripts with a defined promotion flow
  • Works directly with existing Argo CD setups
  • Gives developers clearer visibility into releases
  • Lets platform teams model their full delivery lifecycle

Services:

  • GitOps based promotion flow management
  • CI and CD through container focused pipelines
  • Environment mapping and application promotion
  • Support and guidance for Argo CD implementations
  • Developer self service for deployments
  • Training resources around GitOps and Argo CD

Contact Information:

  • Website: codefresh.io
  • LinkedIn: www.linkedin.com/company/codefresh
  • Twitter: x.com/codefresh
  • Facebook: www.facebook.com/codefresh.io

6. Harness

Harness shows up a lot when teams start comparing Argo CD with more all-in-one delivery platforms. Instead of only focusing on GitOps, they try to cover the whole deployment flow in one place. Their setup leans heavily on UI driven pipelines, verification steps, and built in integrations instead of relying on a maze of custom scripts. For teams that want something a bit more guided and less DIY than Argo CD, Harness tends to fit that space pretty naturally.

They also offer GitOps features for teams that still want a repo centric workflow but with more tooling around it. Things like bidirectional sync, diff views, and triggers based on Git events feel familiar to anyone used to Argo CD, but Harness wraps those features inside a larger platform that handles containers, serverless, traditional apps, and a bunch of operational checks. It makes sense as an Argo CD alternative when a team wants GitOps but also wants pipelines, verification, and deployment automation all sitting together.

Key Highlights:

  • Often chosen as an Argo CD alternative when teams want a more complete delivery platform
  • Supports GitOps workflows with repo based sync and change tracking
  • Pipelines include verification, approvals, and custom scripting
  • Works with different workload types, not just Kubernetes
  • Integrates with secrets managers, monitoring tools, and ticketing systems

Services:

  • Continuous delivery pipelines
  • GitOps based deployment management
  • Deployment verification using monitoring tools
  • Secrets management integrations
  • Pipeline triggers based on Git events or custom conditions
  • Support for containers, serverless, and traditional application stacks

Contact Information:

  • Website: www.harness.io
  • Address: 55 Stockton Street, Floor 8, San Francisco CA 94108 USA
  • LinkedIn: www.linkedin.com/company/harnessinc
  • Twitter: x.com/harnessio
  • Instagram: www.instagram.com/harness.io
  • Facebook: www.facebook.com/harnessinc

7. Devtron

Devtron shows up pretty often when teams want something that still uses Argo CD under the hood but adds a bit more structure around day-to-day work. Instead of juggling several tools to get visibility, manage clusters, and keep track of policies, they roll everything into one place. Their platform gives teams a clearer view of what is running where, and it adds checks around security and release flow that many people usually stitch together themselves.

They also focus a lot on making multi-cluster work less painful. Teams can manage promotions, enforce policies, and handle complex releases without constantly switching context. Since Devtron plugs into existing CI tools, it fits nicely for teams that want an Argo CD alternative but do not necessarily want to replace the whole pipeline. It is more about giving Argo CD extra guardrails and better orchestration rather than moving away from GitOps.

Key Highlights:

  • Often used as an Argo CD alternative for teams wanting more orchestration and visibility
  • Built around Kubernetes with support for multi-cluster deployments
  • Adds security checks and policy enforcement into the deployment flow
  • Extends GitOps workflows with release management tools
  • Connects to external CI systems for flexible pipelines
  • Supports advanced deployment strategies like blue-green and canary

Services:

  • Application lifecycle management
  • GitOps based deployment and environment management
  • Security scanning and policy enforcement
  • Release orchestration for multi service deployments
  • CI integration and custom pre and post steps
  • Deployment strategies with automated health checks

Contact Information:

  • Website: devtron.ai
  • Address: 8 The Green Ste A,  Dover, Kent,  Delaware, 19901 – USA
  • LinkedIn: www.linkedin.com/company/devtron-labs
  • Twitter: x.com/DevtronL

8. Plural

Plural tends to appeal to teams that are running more than just a couple of clusters and want some structure around all the moving pieces. Instead of treating GitOps as something that only applies to app deployments, they fold it into how the entire platform is managed. Their setup leans on an agent model, so clusters across different environments stay connected without everyone having to babysit them. It gives platform teams a way to keep both apps and infrastructure changes flowing through pull requests, which feels familiar if you’re already used to Argo CD but need something that scales a bit cleaner.

They also focus a lot on making life easier for developers. Plural gives them a self-service setup through GitHub pull requests, which means they can push changes without waiting on a platform engineer every time. The Terraform integration is a big part of this, letting teams manage cloud resources and Kubernetes stuff under the same workflow. As an Argo CD alternative, Plural fits well when the goal is to manage entire clusters and fleets, not just deploy workloads.

Key Highlights:

  • Often used by teams running large or distributed Kubernetes fleets
  • GitOps based deployment combined with Terraform automation
  • Agent based model for managing clusters across clouds or on-prem
  • Developer self service through PR workflows
  • Unified control plane for multi cluster operations

Services:

  • GitOps driven continuous delivery
  • Terraform based infrastructure automation
  • Cluster fleet management via agents
  • Self service deployment workflows
  • Multi cloud and on premises support

Contact Information:

  • Website: www.plural.sh
  • Email: support@plural.sh
  • Address: 12 East 49th Street, Floor 11, New York, NY, 10017 USA
  • LinkedIn: www.linkedin.com/company/pluralsh
  • Twitter: x.com/plural_sh

9. Tekton

Tekton comes up a lot when teams want something more flexible than Argo CD and prefer building their own CI/CD flow piece by piece. Instead of giving you one predefined pipeline model, Tekton hands you the building blocks and lets you assemble things the way your team actually works. Everything runs natively on Kubernetes, so the workflow feels consistent whether you’re building, testing, or deploying across different environments.

They also lean into standardization, which helps when a team is juggling tools from different vendors or mixing cloud and on-prem setups. Tekton pipelines can sit under other platforms like Jenkins X or Skaffold, but plenty of teams use it on its own as an Argo CD alternative when they want more control over how automation fits into their GitOps flow. It’s not trying to replace Argo CD directly. It’s more like giving you the low level pieces to craft your own version of a delivery system.

Key Highlights:

  • Used as an Argo CD alternative for teams wanting more customizable pipelines
  • Kubernetes native framework for building CI/CD systems
  • Works alongside tools like Jenkins, Jenkins X, Skaffold, and Knative
  • Designed for flexible workflows tailored to team requirements
  • Encourages standardization across vendors and environments

Services:

  • Pipeline and task orchestration
  • Build, test, and deploy automation
  • Integration with existing CI/CD platforms
  • Cloud native execution across providers
  • Extensible components for custom workflows

Contact Information:

  • Website: tekton.dev

10. GoCD

GoCD tends to attract teams that want more visibility into how work actually moves from commit to production. Instead of focusing on GitOps like Argo CD, they lean into pipeline modeling and traceability. Their value stream map gives a full picture of every step in the delivery path, which is handy when a team has a lot of moving parts and wants to see where things slow down or break. It feels more like a workflow engine than a Git syncing tool, which is exactly why some teams consider it an Argo CD alternative when they need deeper control over the delivery flow.

They also put effort into handling complex pipelines without needing a pile of add-ons. Parallel execution, dependency management, and detailed change tracking are built in, so teams can troubleshoot without digging through different tools to figure out what went wrong. GoCD fits well when you want strong pipeline orchestration and a clear view of how everything connects, especially in setups where the deployment story goes beyond Kubernetes.

Key Highlights:

  • Often chosen as an Argo CD alternative for teams needing detailed pipeline modeling
  • Built in value stream visualization for full delivery flow insight
  • Supports complex pipeline structures with dependencies and parallel execution
  • Cloud native support for Kubernetes, Docker, and common cloud platforms
  • Offers strong traceability for commits and builds
  • Extensible through a plugin system

Services:

  • CI/CD pipeline orchestration
  • Value stream mapping and workflow visualization
  • Build and deploy automation across cloud and container environments
  • Detailed audit and traceability features
  • Plugin integration for external tools
  • Community support and documentation

Contact Information:

  • Website: www.gocd.org

11. Octopus Deploy

Octopus Deploy is the sort of tool teams look at when they’ve outgrown the simple “push to cluster and hope for the best” model. Instead of trying to act like a GitOps controller the way Argo CD does, they focus on everything that happens after your CI pipeline finishes. Their whole thing is taking the deploy step off your plate and giving you one place to run releases, manage environments, and keep deployments consistent no matter where the app ends up living. It fits especially well in setups where Kubernetes is only part of the picture and teams still have to deploy to VMs, cloud services, or on prem machines.

They also lean pretty heavily into making complex deployments repeatable without drowning in scripts. Octopus pipelines can model approvals, promotions, runbooks, and all the day to day operational tasks that usually get scattered across ad hoc tools. And for teams already using Argo CD, they don’t force a replacement. Octopus can sit on top and coordinate GitOps deployments across clusters while adding compliance controls and a central view. That flexibility is a big reason people bring it up when talking through Argo CD alternatives.

Key Highlights:

  • Often used as an Argo CD alternative when deployments span more than Kubernetes
  • Handles release orchestration and environment management in one place
  • Supports multi cloud, on prem, and container based deployments
  • Works alongside existing CI tools instead of replacing them
  • Can automate GitOps flows on top of Argo CD setups
  • Offers compliance features, RBAC, audit logs, and approval flows

Services:

  • Deployment and release automation
  • Runbook automation for operational tasks
  • Environment promotion and version tracking
  • Multi cloud and on premises deployment support
  • Integration with CI servers and IaC tools
  • Centralized dashboard for monitoring deployments across targets

Contact Information:

  • Website: octopus.com
  • Email: sales@octopus.com
  • Phone: +1-512-823-0256
  • LinkedIn: www.linkedin.com/company/octopus-deploy
  • Twitter: x.com/OctopusDeploy

12. Qovery

Qovery is one of those platforms that shows up when teams want the convenience of a PaaS but still need the power and flexibility of Kubernetes. Instead of expecting developers to deal with manifests, cluster quirks, or a pile of IaC templates, they wrap all of that into a workflow that feels closer to a simple git push. Their whole angle is giving teams a full platform that handles infrastructure, deployment steps, and scaling without requiring everyone to become a Kubernetes expert. For folks comparing Argo CD alternatives, Qovery stands out because it does way more than sync resources from Git.

They also lean heavily into automation, especially around GitOps. Instead of writing YAML by hand, the platform generates and manages the manifests behind the scenes and keeps everything in Git so you still get traceability without the manual overhead. Qovery is the kind of choice teams make when they want Kubernetes capabilities without all the usual cognitive load. It fits as an Argo CD alternative not because it behaves like Argo CD, but because it removes the need for Argo CD in the first place by acting as a full deployment platform.

Key Highlights:

  • Often used as an Argo CD alternative for teams wanting a full platform rather than a single GitOps controller
  • Automates infrastructure, networking, databases, and deployment workflows
  • Developer friendly workflow similar to a PaaS style git push deployment
  • Automatically handles Kubernetes manifests and GitOps syncing
  • Runs inside your own cloud account for data control
  • Includes enterprise features like RBAC and audit logging

Services:

  • Automated provisioning of infrastructure and environments
  • GitOps based deployment and manifest management
  • Application scaling and lifecycle automation
  • Multi cloud deployment across AWS, GCP, and Azure
  • Database and networking setup
  • Compliance and access control features

Contact Information:

  • Website: www.qovery.com
  • Email: support@qovery.com
  • Address:  128 rue la Boétie, 75008 Paris France
  • LinkedIn: www.linkedin.com/company/qovery
  • Twitter: x.com/qovery_

13. Northflank

Northflank is one of those platforms that tries to cover the whole delivery story instead of just the Kubernetes part. They take GitOps and stretch it across everything a team usually has to manage: applications, databases, background jobs, AI workloads, and all the little pieces that normally live outside a GitOps setup. Instead of pushing YAML back and forth, they use templates to describe the whole stack, which makes things feel a lot cleaner when you’re working with multiple environments. It ends up being a nice fit for teams that like the ideas behind Argo CD but need something that handles more than cluster resources.

They also make the back and forth between Git and the UI feel pretty natural. If you make changes in Git, Northflank picks them up. If you click around in the UI, it writes those updates back to the repo. That keeps Git as the source of truth without forcing everyone to stop touching the platform directly. And since you can deploy it on their cloud or in your own VPC, it works for teams that have stricter requirements around where things run. Overall, it sits in the Argo CD alternatives conversation because it brings GitOps principles to the entire stack, not just Kubernetes objects.

Key Highlights:

  • GitOps workflow that handles more than Kubernetes manifests
  • Bidirectional sync between Git and the platform
  • Template based infrastructure definitions with reusable patterns
  • Supports apps, databases, jobs, and GPU workloads
  • Can run on Northflank’s managed cloud or inside your own VPC
  • Includes CI/CD pipelines and preview environments

Services:

  • Infrastructure and application deployment using GitOps
  • Built in CI/CD for automatic builds
  • Release flow orchestration
  • Database and job management
  • Multi tenant team management and RBAC
  • Platform hosting on managed or self hosted environments

Contact Information:

  • Website: northflank.com
  • Email: contact@northflank.com
  • Address: 20-22 Wenlock Road, London, England, N1 7GU
  • LinkedIn: www.linkedin.com/company/northflank
  • Twitter: x.com/northflank

14. Portainer

Portainer is one of those tools teams pick up when they want Kubernetes and container management to feel a little less like wrestling with a puzzle and a little more like using a normal platform. Instead of focusing only on GitOps the way Argo CD does, they approach the problem from the angle of day to day operational control. Their interface gives teams a clearer view of what is running across clusters, edge devices, and different container environments without forcing everyone to navigate raw YAML or terminal windows. It fits nicely in conversations about Argo CD alternatives because it solves a different pain point while still supporting GitOps workflows.

They also lean heavily into simplifying how teams scale and govern container environments. Portainer can sit on top of Kubernetes, Docker, and Podman, which works well for companies that have a mix of old and new systems. The platform handles access control, fleet management, and automation in a way that helps teams adopt Kubernetes gradually rather than all at once. It is not trying to replace Argo CD as a GitOps controller. Instead, it complements or replaces it depending on how much control and visibility a team wants from a single place.

Key Highlights:

  • Used as an Argo CD alternative when teams want broader container and cluster management
  • Centralized UI for Kubernetes, Docker, Podman, and edge environments
  • Built in GitOps automation without needing external tools
  • Role based access and policy controls for standardizing operations
  • Fleet management support for large or distributed setups
  • Cloud neutral design that runs on bare metal, cloud, or edge

Services:

  • GitOps based deployment automation
  • Container and cluster management across multiple environments
  • RBAC, SSO, and policy enforcement
  • Edge and IoT device management
  • Operational automation through runbooks and templates
  • Managed platform services for teams that want hands on support

Contact Information:

  • Website: www.portainer.io
  • LinkedIn: www.linkedin.com/company/portainer

15. Heroku

Heroku sits in a different corner of the world compared to Argo CD, but it still ends up on the alternatives list because of how much deployment work it absorbs for teams. Instead of asking developers to learn Kubernetes, manage manifests, or build out their own GitOps pipelines, Heroku wraps the whole experience into a simple push to deploy flow. Their platform takes over everything behind the scenes, from runtime management to scaling to handling databases, which makes it appealing for teams that want to skip the cluster part entirely and focus on building the app.

Even though Heroku is not a GitOps tool, it replaces the need for one in a lot of cases. Their continuous delivery workflow, review apps, quick rollbacks, and built in governance features mean many teams never feel the need to manage deployments at the Kubernetes level. The platform has also expanded into AI focused tooling, managed inference, and a deep add on ecosystem. So while it is not trying to compete with Argo CD on cluster control, it does offer a much simpler path for teams that would rather trade low level control for a cleaner developer experience.

Key Highlights:

  • Provides a managed platform that replaces manual Kubernetes and GitOps work
  • Simple deployment flow that avoids the need for manifests or custom pipelines
  • Built in features for scaling, rollback, metrics, and runtime management
  • Large add on and buildpack ecosystem for extending applications
  • Support for many languages and custom stacks
  • Enterprise options like private spaces, advanced security, and SSO

Services:

  • Application deployment and runtime management
  • Managed Postgres and key value data services
  • Review apps and continuous delivery workflows
  • Buildpacks for customizing language stacks
  • Enterprise hosting with isolation and compliance
  • Team and resource management for larger organizations

Contact Information:

  • Website: www.heroku.com
  • Address: 415 Mission Street, 3rd Floor, San Francisco, CA 94105, United States
  • LinkedIn: www.linkedin.com/company/heroku
  • Twitter: x.com/heroku


Wrapping It Up

Argo CD might have kicked off a whole wave of GitOps adoption, but the ecosystem around it has grown into something much wider and more flexible. There’s no single path teams follow anymore. Some want tight control over clusters, some want to offload the infra burden entirely, and others just need a cleaner workflow that fits how their developers already work.

The good news is there’s plenty to choose from. Whether you lean toward platforms that simplify everything or tools that give you more room to customize, there’s an option that matches how your team thinks and ships. If you’re unsure where to begin, try one or two on a small project. You’ll quickly figure out which approach feels natural and which one adds more friction than it solves.


Top Gatling Alternatives for Everyday Load Testing

Load testing isn’t as simple as it used to be. Apps are bigger, traffic is weirdly unpredictable, and nobody has time to babysit brittle scripts all week. Gatling is still fine for plenty of folks, but it’s totally fair if it feels a bit heavy or just not the right fit anymore.

There are quite a few leading companies doing this in their own way now. Some give you a cleaner, more forgiving workflow. Others take over the whole thing so you don’t have to think about servers or test runners at all. This rundown isn’t about picking a “best” tool. It’s more like a quick tour of what’s out there so you can see which option matches the way your team actually works in real life.

1. AppFirst

AppFirst isn’t a load testing tool in the traditional sense, but it still shows up in conversations about Gatling alternatives because some teams simply want to avoid dealing with infrastructure altogether. Instead of writing Terraform, managing VPCs, or wrestling with cloud config, they describe what their application needs and let AppFirst handle the rest. It appeals to teams that want to move fast without building their own internal platform or relying on a heavy DevOps setup to deploy new services.

They focus on giving developers a way to ship apps without worrying about the plumbing underneath. Logging, monitoring, alerting, networking, databases, and all the usual pieces get provisioned automatically across whatever cloud a team uses. For groups thinking about performance and stability but not interested in maintaining test infrastructure, AppFirst offers a different angle compared to Gatling itself. It removes the friction around deployment so teams can focus on writing code and evaluating how their apps behave once they’re live.

Key Highlights:

  • Considered by teams who want to avoid managing infrastructure while evaluating Gatling alternatives
  • Lets developers define app requirements instead of writing cloud config
  • Provides built-in logging, monitoring, and alerting
  • Works across AWS, Azure, and GCP
  • Offers SaaS and self-hosted deployment

Services:

  • Automatic provisioning of cloud infrastructure
  • Built-in observability tools
  • App centric cost visibility and auditing
  • Multi cloud support
  • Self-hosted and managed SaaS options

Contact Info:

2. Apache JMeter

Apache JMeter often comes up when people start looking for Gatling alternatives. It’s been around for a long time, and teams usually turn to it when they want something open source that doesn’t lock them into one way of doing load testing. JMeter works at the protocol level, so it handles a lot of different scenarios without pretending to be a full browser. It’s not fancy, but it gives technical teams a familiar, flexible setup that they can shape however they need.

Because it’s an Apache project, the community keeps adding extensions and plugins, which makes it easier to adapt JMeter to weird or older systems that newer tools sometimes struggle with. Some folks say parts of it feel dated, but the tradeoff is that it stays stable and predictable. For anyone comparing options and wanting something that can test a wide mix of protocols without much drama, JMeter ends up being a practical option next to Gatling.

Key Highlights:

  • Commonly used as an open source Gatling alternative
  • Works at protocol level instead of mimicking a browser
  • Supports many different application and protocol types
  • Can be extended through plugins and scripting
  • Runs anywhere Java runs

Services:

  • Load and performance testing
  • Stress and scalability testing
  • Support for HTTP, API, messaging, and other protocols
  • Test plan recording and debugging
  • CI pipeline integrations
  • Custom scripting and extensions

Contact Info:

  • Website: jmeter.apache.org
  • Twitter: x.com/ApacheJMeter

3. K6 by Grafana

k6 is built by Grafana is usually one of the first tools people bump into when they start looking for a Gatling alternative. It leans heavily toward a developer-friendly setup, especially since the scripting is done in JavaScript, which makes it feel familiar for a lot of teams. They focus on giving engineers a way to write tests that don’t feel like a chore, whether you’re running something small on your laptop or pushing much heavier tests through their cloud platform. The tool covers load testing at its core, but it also stretches into things like browser checks and synthetic monitoring, which makes it useful when teams want one setup instead of juggling multiple tools.

What makes k6 stand out among Gatling alternatives is how much effort they’ve put into making the workflow feel simple and consistent. You can write one script and run it pretty much anywhere, which takes away a lot of the usual friction. They have extensions for different protocols and frameworks, plus integrations with plenty of common dev tools, so it fits into most setups without a lot of ceremony. People tend to use k6 when they want a straightforward, code-first approach but without the heavier JVM-style process that comes with Gatling.

Key Highlights:

  • Popular option when comparing Gatling alternatives
  • Test scripting in JavaScript
  • One script works for local, distributed, and cloud runs
  • Supports browser checks, APIs, and other testing types
  • Integrates with common engineering and monitoring tools

Services:

  • Load and performance testing
  • Browser and end-to-end testing
  • Synthetic monitoring
  • Fault and resilience testing for cloud-native systems
  • Infrastructure and scalability testing
  • Continuous regression and reliability checks

Contact Info:

  • Website: grafana.com
  • Email: info@grafana.com 
  • LinkedIn: www.linkedin.com/company/grafana-labs
  • Twitter: x.com/grafana
  • Facebook: www.facebook.com/grafana

4. LoadForge

LoadForge usually comes up when teams want a Gatling alternative that feels easier to get going with. Instead of writing everything from scratch, they give people a few different ways to build tests, like recording browser sessions or uploading API specs. That setup tends to appeal to teams that want something more guided, especially when they need to test sites, APIs, or whole user flows without spending all day writing scripts. They also let you kick off tests from your CI pipeline, which helps when you want performance checks to run in the background instead of becoming a separate chore.

They position themselves more as a platform than just a tool, which means they cover a bunch of areas that go beyond basic load testing. Teams like that they can scale tests up or down without thinking much about the underlying setup, and the reporting is built to help people understand what went wrong without digging through logs. For anyone comparing options and wanting something that handles both the test creation and the heavy lifting in the cloud, LoadForge ends up being a practical alternative to Gatling.

Key Highlights:

  • Often used as a more guided alternative to Gatling
  • Lets teams create tests through recordings, API files, or Python scripts
  • Works for websites, APIs, and browser-driven flows
  • Scales tests without requiring infrastructure setup
  • Provides reporting that focuses on readable insights

Services:

  • Load and stress testing for websites and APIs
  • Browser session recording and playback
  • API test generation from specifications
  • CI pipeline integrations for automated performance checks
  • Cloud-based test execution
  • Reliability and performance analysis

Contact Information:

  • Website: loadforge.com
  • Email: help@loadforge.com
  • Phone: (510) 944-1376
  • Address: 651 North Broad Street Middletown, DE 19709 United States of America

5. Loadium

Loadium is another option teams look at when they want something a bit different from Gatling but still familiar enough that the learning curve isn’t painful. They work with a lot of open source tools, so people who already use JMeter or Gatling can plug their existing scripts into the platform instead of starting from zero. What usually stands out is that they try to make test creation less frustrating by offering things like a script builder and a Chrome recorder. That tends to help teams who want to get tests running quickly without spending hours writing everything by hand.

They also give teams the option to run tests in the cloud or on their own setup, which is useful when you have different environments or security requirements. Their dashboard focuses on making the results easier to read, especially when you’re trying to track down bottlenecks. For anyone comparing tools and wanting something that keeps one foot in the open source world while adding a bit more convenience, Loadium ends up being a reasonable alternative to Gatling.

Key Highlights:

  • Often chosen as a more flexible alternative to Gatling
  • Supports open source tools like JMeter, Gatling, and Selenium
  • Includes a no-code script builder and recording tools
  • Can run tests in the cloud or on-premise
  • Reporting is designed to help teams spot performance issues quickly

Services:

  • Load and stress testing for web apps and APIs
  • Script creation through recorders and no-code tools
  • Open source script execution
  • Cloud and on-premise load generation
  • CI pipeline integrations
  • Performance analysis and troubleshooting

Contact Information:

  • Website: loadium.com
  • LinkedIn: www.linkedin.com/company/loadium
  • Twitter: x.com/loadiumcom
  • Facebook: www.facebook.com/loadiumcom

6. BlazeMeter

BlazeMeter is one of the tools teams look at when they outgrow Gatling or just want something that covers more parts of the testing process in one place. They take a broad approach, mixing performance testing with things like API checks and functional testing, so teams can keep everything under a single setup instead of juggling several tools. Because it works with open source technologies like JMeter and Gatling itself, people often use BlazeMeter as a way to run bigger or more organized versions of the tests they already have.

They also offer service virtualization and other pieces that help when a team needs to test systems that rely on unavailable or unstable components. The platform leans toward simplifying the day-to-day work around testing, especially when companies want to fold load tests into their CI pipelines. For anyone comparing options and needing something that supports both open source scripts and more structured workflows, BlazeMeter ends up being a practical alternative to Gatling.

Key Highlights:

  • Common choice for teams exploring Gatling alternatives
  • Works with open source tools like JMeter, Gatling, and Selenium
  • Covers performance, API, and functional testing in one setup
  • Offers service virtualization for testing complex systems
  • Designed to fit into CI workflows

Services:

  • Load and performance testing
  • API testing and monitoring
  • Functional testing
  • Service virtualization
  • Test automation support
  • CI pipeline integrations

Contact Information:

  • Website: www.blazemeter.com

7. PFLB

PFLB is another option teams look at when they want something more structured than Gatling but still developer friendly. They focus on helping people run load tests in the cloud without having to manage any of the underlying setup. Most teams that pick up PFLB usually want an easier way to handle larger tests or reuse things they already have, like JMeter scripts or Postman collections. Their platform leans on automation and AI to explain results, which helps when teams don’t have hours to dig through reports manually.

They also try to cover different testing needs in one place, so performance engineers, QA teams, and DevOps folks can use the same tool instead of juggling different ones. A lot of what they offer is built around making repeat testing less painful, especially when running tests straight from CI. For anyone comparing Gatling alternatives and wanting something that handles the heavy lifting while still supporting open source workflows, PFLB ends up fitting that space pretty well.

Key Highlights:

  • Considered by teams as a more automated alternative to Gatling
  • Works with JMeter, Postman, and HAR files
  • Cloud based load execution with AI assisted insights
  • Designed for repeated tests and CI usage
  • Helps teams understand performance issues without deep manual analysis

Services:

  • Load and performance testing
  • API, web, and gRPC testing
  • Cloud based load generation
  • Automated test analysis with AI
  • CI pipeline integrations
  • Professional support for performance testing

Contact Information:

  • Website: pflb.us
  • Email: sales@pflb.us
  • Phone: +14084182552
  • Address: 2810 N Church St, PMB 729811, Wilmington, Delaware 19802-4447, US
  • LinkedIn: www.linkedin.com/company/pflb
  • Twitter: x.com/pflb22

8. OctoPerf

OctoPerf is often considered by teams who want a Gatling alternative that still feels familiar but removes a lot of the overhead that comes with managing load testing infrastructure. They focus on giving users a browser based way to build and run tests, which appeals to teams who want something easier to operate than a fully script driven workflow. Because OctoPerf supports tools like JMeter under the hood, people can reuse what they already have while getting a smoother interface and less setup work.

They also lean into helping teams structure tests for web apps, APIs, and more complex user flows without forcing them into a single testing style. A lot of teams use OctoPerf when they want to scale tests quickly or collaborate without dealing with local environments. For anyone comparing load testing platforms and looking for something that sits between open source flexibility and a cleaner cloud experience, OctoPerf usually fits that middle ground pretty well.

Key Highlights:

  • Often used as a simpler alternative to Gatling
  • Provides a browser based interface for building and running tests
  • Supports JMeter projects for easier migration
  • Scales tests in the cloud without local setup
  • Helps teams collaborate on performance scenarios

Services:

  • Load and performance testing
  • API and web application testing
  • Cloud based load generation
  • JMeter project import and execution
  • Test result reporting and analysis

Contact Information:

  • Website: octoperf.com
  • Email: contact@octoperf.com
  • Phone: +334 42 84 12 59
  • Address: Avantages Buro, ZI Les Paluds, 276 Avenue du Douard, 13400 Aubagne, France
  • LinkedIn: www.linkedin.com/company/octoperf

9. Artillery

Artillery is one of the tools people look at when they want something lighter and more flexible than Gatling but still powerful enough to handle real load testing. They focus a lot on developer workflows, which means teams can write tests the same way they write their application code. Because Artillery supports both API and browser based testing, it fits well for teams that need to check more than just backend performance. Their platform also mixes local runs with cloud execution, so teams can start small and scale only when they need to.

They also put effort into keeping everything in one place, from Playwright E2E tests to load testing and even early monitoring. Many teams like that they can reuse existing Playwright tests or run distributed browser tests without managing their own infrastructure. For anyone comparing Gatling alternatives and wanting a setup that feels modern and code friendly, Artillery often ends up being a comfortable fit.

Key Highlights:

  • Often picked as a more flexible, code friendly alternative to Gatling
  • Supports API, GraphQL, WebSocket, and browser based load testing
  • Works with Playwright tests for end to end or browser heavy scenarios
  • Lets teams run tests locally or with cloud runners
  • Integrates easily with CI pipelines and monitoring tools

Services:

  • Load and performance testing
  • Playwright based browser testing
  • Distributed load testing in the cloud
  • Synthetic monitoring for key user journeys
  • CI and developer workflow integrations
  • Reporting and debugging tools for test analysis

Contact Information:

  • Website: www.artillery.io
  • Email: support@artillery.io
  • Address: 169 Madison Avenue, #2096, New York, NY 10016 USA
  • Twitter: x.com/artilleryio

10. Locust

Locust is one of those tools people bring up when they want a Gatling alternative that stays close to actual coding instead of pushing them into a heavy UI. The whole idea is built around defining user behavior in Python, which feels natural for teams who prefer writing tests the same way they write the rest of their backend logic. It keeps things simple on purpose, letting you describe what users do and then scale that out across as many machines as you need.

They also lean on a clean, script driven setup instead of layers of configuration files or complex editors. Because of that, teams often reach for Locust when they want a load testing tool that gets out of the way but still handles big workloads. It works well for APIs and web apps, and because everything sits in code, it’s easy to version, share, and automate. For anyone comparing Gatling alternatives and wanting something that feels straightforward and developer friendly, Locust fits that space pretty naturally.

Key Highlights:

  • Often chosen as a simple, code based alternative to Gatling
  • Tests are written in plain Python
  • Supports distributed testing across multiple machines
  • Good fit for API and web load testing
  • Open source with an active community

Services:

  • Python based load test creation
  • API and web application testing
  • Distributed load generation
  • CLI based test execution
  • Hosted option available through Locust.cloud
  • Community and contributor support

Contact Information:

  • Website: locust.io
  • Twitter: x.com/locustio

11. BrowserStack

BrowserStack is usually known for cross browser and device testing, but they also offer load testing now, which puts them on the list for teams comparing Gatling alternatives. Their approach leans toward running load in a more realistic, browser based way, so teams can see how both the frontend and backend behave under pressure. It works well for anyone who already uses BrowserStack for functional testing and wants to reuse those scripts instead of writing a whole new set just for load.

They also keep things pretty hands off when it comes to infrastructure. Teams can run tests from different regions, watch metrics as they happen, and debug from one place without spinning up machines or installing anything. It’s the kind of setup that appeals to people who want something simple to operate but still want meaningful insights. For anyone comparing Gatling with cloud platforms that focus on ease of use, BrowserStack often lands in that category.

Key Highlights:

  • Considered by teams as an easier, browser oriented alternative to Gatling
  • Uses existing functional test scripts for load testing
  • Simulates frontend and backend load together
  • Fully managed infrastructure with no setup needed
  • Supports load tests across multiple regions

Services:

  • Browser based load testing
  • API load testing
  • Real time performance monitoring
  • Unified reporting and debugging tools
  • CI pipeline integrations
  • Cross browser and device testing tools

Contact Information:

  • Website: www.browserstack.com
  • Email: support@browserstack.com
  • Phone: +1 (409) 230-0346
  • Address: 4512, Suite # 100, Legacy Drive, Plano TX 75024 USA
  • LinkedIn: www.linkedin.com/company/browserstack
  • Twitter: x.com/browserstack
  • Instagram: www.instagram.com/browserstack
  • Facebook: www.facebook.com/pages/BrowserStack

Conclusion

Looking at all these Gatling alternatives side by side, the main takeaway is that teams have way more room to pick something that actually fits how they work. Some tools lean into code first testing, others smooth out the setup with cloud platforms, and a few try to keep everything in one place so you’re not juggling scripts, reports, and infrastructure on your own.

If you’re unsure where to start, trying one or two options with a small test run usually tells you more than any long comparison chart. Every team has its own quirks, and the right tool is usually the one that feels less like a chore and more like something you won’t mind using every week. Once you find that fit, the whole performance testing process becomes a lot less painful.


Top Nagios Alternatives for Reliable IT Monitoring

Nagios has been around forever, and plenty of teams still rely on it. But as systems get more distributed and noisy, many companies are moving toward tools that feel a bit more flexible and easier to live with day to day. The good news is that the monitoring space has grown a lot, and there are now several strong platforms that handle alerts, logs, and performance data without the heavy setup that Nagios is known for.

In this guide, we’ll walk through some of the more capable options on the market right now. These are companies that build monitoring tools designed for the kind of environments most teams actually deal with today messy, fast changing, and packed with different services that all need to stay in sync. The aim here isn’t to crown a winner, but to give a clear look at who’s doing what so you can pick something that fits how your team works, not the other way around.

1. AppFirst

AppFirst takes a pretty unconventional route compared to classic monitoring tools like Nagios. Instead of asking teams to wire up infrastructure, write Terraform, or glue together plugins, they flip the whole workflow around. Their idea is simple enough: developers should describe what their application needs, and the system should take care of the infrastructure and the guardrails. That includes monitoring, logging, alerting, and all the things that normally get bolted on later. It’s an approach that appeals to teams who want to move fast without getting buried in cloud configuration or DevOps queues.

They also lean heavily into consistency and security. Once an app’s requirements are defined, AppFirst handles provisioning across AWS, Azure, or GCP using the provider’s recommended practices. Teams don’t have to micromanage networking rules or IAM policies. The monitoring piece is built in, so nobody is scrambling to install agents or integrate dashboards after the fact. For teams exploring Nagios alternatives, AppFirst fits into the picture as a way to get observability without the usual setup overhead.

Key Highlights:

  • Application-first approach to infrastructure
  • Built-in logging, monitoring, and alerting
  • Cloud best practices applied automatically
  • Works across AWS, Azure, and GCP
  • Designed for teams who want fewer DevOps bottlenecks

Services:

  • Automated infrastructure provisioning
  • Built-in monitoring and alerting
  • Centralized audit and compliance tooling
  • Cost visibility by app or environment
  • Support for SaaS or self-hosted deployments
  • Workflow simplification for multi cloud teams

Contact Info:

2. Icinga

Icinga sits in an interesting spot when people start looking for Nagios alternatives. They began years ago as a fork of Nagios, but over time they moved far beyond those roots. Now they run a monitoring platform that feels more in tune with how modern systems behave. Instead of relying on older workflows, they built an architecture that fits teams juggling cloud setups, distributed services, or environments that change faster than anyone would like to admit. They focus on giving teams clearer visibility without making every update or config tweak feel like a chore.

They also lean into integrations and automation, which is something many Nagios users eventually end up craving. Rather than expecting people to manage endless text files, Icinga offers tools that cut down on the manual overhead. Their ecosystem includes dashboards, reporting modules, and extensions that help teams stay on top of alerts without drowning in noise. Even though the core stays open source, they do offer support and guidance for companies that want a smoother transition away from older monitoring habits.

Key Highlights:

  • Positioned as a practical Nagios alternative
  • Originally a fork but fully rebuilt into a modern monitoring system
  • Handles distributed or mixed environments without extra complexity
  • Automation friendly with a solid range of integrations
  • Open source with community support and optional enterprise help

Services:

  • Infrastructure and service monitoring
  • Network and Kubernetes monitoring
  • Alerting and notification management
  • Integrations with Prometheus, Grafana, Elastic, Ansible, and others
  • Consulting, training, and support options

Contact Information

  • Website: icinga.com
  • Email: info@icinga.com
  • Phone: +49 911 9288555
  • Address: Deutschherrnstr. 15-19 90429 Nuremberg, Germany
  • LinkedIn: www.linkedin.com/company/icinga
  • Facebook: www.facebook.com/icinga

zabbix

3. Zabbix

Zabbix is one of those names that comes up pretty quickly when teams start looking for Nagios alternatives. They build an open source monitoring platform that tries to keep everything in one place, whether someone is dealing with servers, network gear, cloud workloads, or a mix of all of it. Their setup is flexible enough that companies use it in all kinds of environments, from traditional on-prem systems to big distributed infrastructures. They focus on giving users a clear view of what is going on across their stack without forcing them into a specific way of working.

They also offer different ways to run their platform, which is handy for teams that prefer full control or just want something hosted. With their on-prem option, users keep everything in their own environment. For those who want less maintenance, there is a cloud version where Zabbix handles the hosting and scaling. They also allow deployments on AWS, Azure, and other cloud platforms. Alongside the product, they run training, support, and consulting services for teams that want to set things up properly or improve what they already have.

Key Highlights:

  • Open source monitoring platform used across many industries
  • Works for on-prem, cloud, and hybrid setups
  • Offers both self-hosted and fully managed cloud options
  • Flexible architecture suitable for mixed environments
  • Global team and partner network providing support

Services:

  • Infrastructure and network monitoring
  • Log and metric collection
  • Alerting and incident workflows
  • Integrations with cloud services and third party tools
  • Support, consulting, and training
  • Deployment, upgrade, and migration assistance

Contact Information:

  • Website: www.zabbix.com
  • Email: sales@zabbix.com
  • Phone: +18774922249
  • Address: Address: 211 E 43rd Street, Suite 7-100, New York, NY 10017, USA
  • LinkedIn: www.linkedin.com/company/zabbix
  • Twitter: x.com/zabbix
  • Facebook: www.facebook.com/zabbix

prometheus

4. Prometheus

Prometheus shows up a lot when teams start moving away from classic tools like Nagios and into more cloud heavy setups. They focus almost entirely on metrics, which makes their approach feel pretty different from the older monitoring style. Instead of relying on plugins for everything, they collect time series data and let users slice and query it however they need. Their system fits well in places where containers, microservices, and fast changing environments are the norm. They keep things simple to run, but not in a way that limits what people can do with it.

They also lean on a pull based model and offer a huge collection of integrations, so getting data out of existing systems usually isn’t a struggle. Prometheus pairs easily with tools like Grafana, and their alerting setup runs off the same query language, which keeps everything consistent. They stay fully open source and community driven, and their position inside the CNCF means they continue evolving alongside the rest of the cloud native world.

Key Highlights:

  • Metrics focused monitoring built for cloud native environments
  • Works well with Kubernetes and container based setups
  • Pull based model with lots of integrations
  • Uses PromQL for querying and alerting
  • Fully open source and community maintained

Services:

  • Metrics collection and storage
  • Alerting with Alertmanager
  • Integrations with cloud, container, and infrastructure tools
  • Instrumentation libraries for major languages
  • Documentation, community support, and training resources

Contact Info:

  • Website: prometheus.io

5. Paessler

Paessler is the company behind PRTG, which shows up a lot when teams start comparing Nagios to something more user friendly. Instead of leaning on heavy manual configs, they try to offer a monitoring setup that people can get running without spending days sorting through text files. Their tool covers most of the usual monitoring needs in one place, so teams don’t have to stitch together a bunch of add ons just to get visibility over their network, servers, or applications. They aim for something that feels predictable and easy to maintain, which is a big shift from the classic do everything yourself approach.

They also give users a choice in how they want to deploy things. Some teams install PRTG on their own infrastructure, while others go for the hosted version to avoid running it themselves. Either way, Paessler focuses on keeping the setup and daily use straightforward. Alongside the product, they offer support, consulting, and training for companies that want extra help. Their overall approach is less about being flashy and more about giving people a tool that fits into everyday monitoring work without constant headaches.

Key Highlights:

  • Known for PRTG, a monitoring tool often compared to Nagios
  • Focuses on ease of setup and day to day use
  • Offers both self hosted and cloud hosted deployment options
  • Covers network, server, application, and cloud monitoring in one place
  • Support and training available for teams that want guidance

Services:

  • Network and infrastructure monitoring
  • Server and application monitoring
  • Cloud and virtual environment monitoring
  • Dashboards, alerts, and visualization tools
  • Consulting, support, and training services

Contact Information:

  • Website: www.paessler.com
  • Email: info@paessler.com
  • Phone: +49 911 93775-0
  • Address: Thurn-und-Taxis-Str. 14, 90411 Nuremberg Germany
  • LinkedIn: www.linkedin.com/company/paessler-gmbh
  • Instagram: www.instagram.com/paessler.gmbh

6. SolarWinds

SolarWinds is one of those companies people usually look at when they want something a bit more guided than Nagios but still familiar enough that the switch doesn’t feel painful. Their monitoring tools lean toward a plug and play style, which is a big change for teams used to wrestling with text based configs. They focus on helping users get visibility into servers, apps, and general performance issues without having to build everything from scratch. A lot of their products are built in a way that lets teams reuse the Nagios scripts they already rely on, so it doesn’t feel like starting over.

They also try to cover a wide range of environments, from simple on prem setups to more spread out networks with cloud services in the mix. Their tools usually come with dashboards, templates, and features that point people in the right direction instead of leaving them to figure out all the details. On top of that, they offer support and resources for teams that want help with migration or day to day troubleshooting. Overall, their approach is more about reducing the heavy lifting and giving people a monitoring setup that works out of the box.

Key Highlights:

  • Offers monitoring tools often used as a Nagios replacement
  • Supports using existing Nagios scripts inside their platform
  • Focuses on faster setup and easier day to day operation
  • Built in dashboards and templates for common applications
  • Works across on prem, virtual, and cloud based environments

Services:

  • Server and application monitoring
  • Network and infrastructure monitoring
  • Alerts, dashboards, and performance analysis
  • Support for custom scripts and integrations
  • Consulting and support for migration and setup

Contact Information:

  • Website: www.solarwinds.com
  • Email: sales@solarwinds.com
  • Phone: +1-512-682-9300
  • Address: 7171 Southwest Parkway Bldg 400 Austin, Texas 78735 USA
  • LinkedIn: www.linkedin.com/company/solarwinds
  • Twitter: x.com/solarwinds
  • Instagram: www.instagram.com/solarwindsinc
  • Facebook: www.facebook.com/SolarWinds

7. Dynatrace

Dynatrace takes a pretty different angle compared to the older monitoring tools people usually group with Nagios. Instead of relying on plugins and manual setup, they lean heavily into observability and automation, trying to give teams a clearer picture of everything happening across their systems without making them chase logs all day. They work with large and busy environments where things shift constantly, so their platform is built around pulling data together, adding context, and using AI to point out what actually matters. It’s less about watching individual checks and more about understanding the bigger picture.

They also offer a wide set of features that cover applications, infrastructure, digital experience, security, and even business level metrics. All of this runs on one platform, which helps teams avoid juggling multiple tools to understand one problem. Dynatrace pushes a lot of automation too, letting their system handle routine tasks so teams can focus on the stuff that needs real decision making. While it’s definitely a more advanced setup than traditional monitoring, they try to make it something that fits into everyday work rather than something that creates more work.

Key Highlights:

  • Focuses on observability rather than traditional monitoring
  • Uses AI to find issues and reduce manual investigation
  • Brings application, infrastructure, logs, and user experience data into one platform
  • Supports large and fast moving environments
  • Integrates with major cloud platforms and modern tooling

Services:

  • Application and infrastructure observability
  • Log analytics and performance monitoring
  • Digital experience insights
  • Automation for common operational tasks
  • Security and threat visibility
  • Support, training, and implementation services

Contact Info:

  • Website: www.dynatrace.com
  • Email: sales@dynatrace.com
  • Phone: +1.650.436.6700
  • Address: 401 Castro Street, Second Floor Mountain View, CA, 94041 United States of America
  • LinkedIn: www.linkedin.com/company/dynatrace
  • Twitter: x.com/Dynatrace
  • Instagram: www.instagram.com/dynatrace
  • Facebook: www.facebook.com/Dynatrace

8. ManageEngine

ManageEngine is the group behind OpManager, which a lot of teams end up looking at when they want something a bit smoother and less hands on than Nagios. They focus on giving users a monitoring setup that doesn’t require stitching together a dozen plugins before anything useful shows up. Their platform covers networks, servers, storage, virtual machines, and all the usual areas that tend to cause headaches, but they try to present everything in a way that feels more organized and easier to deal with on a daily basis. It’s built for environments where things change often and people don’t have time to babysit configs.

They also pack in automation and some AI driven features to help cut down the repetitive work. Instead of leaving users to figure out every rule or threshold manually, OpManager takes care of a lot of the routine tasks behind the scenes. They offer different tools for logs, configuration management, and performance analysis, and all of them tie back into the same ecosystem so teams aren’t juggling multiple dashboards. Overall, their approach is to reduce friction and give admins a way to manage problems before they get out of hand.

Key Highlights:

  • Known for OpManager, often used as a Nagios alternative
  • Covers network, server, storage, and virtual environments in one tool
  • Built in automation to reduce manual monitoring tasks
  • Offers additional modules for logs, configuration, and traffic analysis
  • Designed for environments that change frequently

Services:

  • Network and server monitoring
  • Virtual infrastructure and storage monitoring
  • Log and configuration management
  • Alerts, dashboards, and reporting
  • Support, training, and deployment assistance

Contact Information:

  • Website: www.manageengine.com
  • Email: sales@manageengine.com
  • Phone: +1 877 834 4428
  • Address: 4141 Hacienda Drive Pleasanton CA 94588 USA
  • LinkedIn: www.linkedin.com/showcase/manageengine-it-operations-management
  • Instagram: www.instagram.com/manageengine_itom

9. Datadog

Datadog tends to come up when teams want something that goes beyond traditional monitoring and gives them a clearer view of everything happening across their stack. Instead of focusing on one piece of infrastructure at a time, they pull in metrics, logs, traces, and security data so teams can see how things connect. It’s built for setups where services move around constantly, and people need answers quickly without digging through a bunch of separate tools. Their platform leans heavily into dashboards, automation, and AI driven insights, which helps cut through a lot of the noise that usually shows up in bigger environments.

They also integrate with pretty much every major cloud and container system, so getting data in usually isn’t complicated. Teams use Datadog when they want smoother troubleshooting, especially in places where performance, cost, and reliability all need to be balanced at once. While the platform does a lot, they try to keep the workflows practical so users can spend more time understanding issues instead of stitching together pipelines. For anyone moving away from Nagios and into more cloud focused work, Datadog often feels like a natural next step.

Key Highlights:

  • Combines metrics, logs, traces, and security data in one place
  • Works well for cloud, container, and serverless environments
  • Offers AI driven insights to speed up troubleshooting
  • Integrates with a wide range of tools and services
  • Built for fast changing, distributed systems

Services:

  • Infrastructure and application monitoring
  • Log management and analytics
  • Security monitoring and threat detection
  • Real user and synthetic monitoring
  • Automation, dashboards, and incident tools
  • Support, training, and implementation help

Contact Info:

  • Website: www.datadoghq.com
  • Email: info@datadoghq.com
  • Phone: 866 329-4466
  • Address: 620 8th Ave 45th Floor New York, NY 10018 USA
  • LinkedIn: www.linkedin.com/company/datadog
  • Twitter: x.com/datadoghq
  • Instagram: www.instagram.com/datadoghq
  • App Store: apps.apple.com/app/datadog
  • Google Play: play.google.com/store/apps/datadog.app

10. Middleware

Middleware is a newer name in the monitoring space, but they approach the problem in a way that lines up with what a lot of teams want after outgrowing Nagios. Instead of juggling separate tools for metrics, logs, and traces, they pull everything into one place so people can actually see how issues connect. Their platform is built to handle most of what modern setups throw at it, whether it’s cloud workloads, containers, or a mix of on prem systems that haven’t gone anywhere yet. The idea is to simplify the noisy parts of monitoring and make troubleshooting feel less like hunting in the dark.

They also give users a fair amount of control over what data gets collected, which helps keep things manageable and avoids drowning teams in information they don’t need. Alerting, dashboards, and correlation are built in, so the basic workflows don’t require extra add ons. Middleware aims for something that’s easy to get started with, without sacrificing flexibility as environments grow. Even though they’re still building their name, the platform has a clear direction and fits well for teams wanting a cleaner, more unified alternative to traditional tools.

Key Highlights:

  • Brings metrics, logs, and traces together in one platform
  • Real time visibility across servers, containers, VMs, and cloud services
  • One click correlation to speed up troubleshooting
  • Custom dashboards and alerting
  • Supports on prem, cloud, and hybrid environments

Services:

  • Infrastructure and application monitoring
  • Kubernetes monitoring with built in dashboards
  • Log and trace collection
  • Alerting and incident workflows
  • Setup assistance and platform support

Contact Info:

  • Website: middleware.io
  • Email: hello@middleware.io
  • Address: 133, Kearny St., Suite 400, San Francisco, CA 94108
  • LinkedIn: www.linkedin.com/company/middleware-labs
  • Twitter: x.com/middleware_labs
  • Facebook: www.facebook.com/middlewarelabs

11. NinjaOne

NinjaOne sits in a slightly different corner of the monitoring world, mostly because they focus on endpoints and day to day IT operations instead of classic infrastructure checks. But a lot of teams looking to replace Nagios end up considering them anyway, especially if their biggest pain points come from managing laptops, servers, and remote devices rather than deep network monitoring. Their platform is built around keeping everything in one place so IT teams can spot issues early, patch systems quickly, and keep track of what’s going on across a messy mix of local and remote environments.

They lean heavily on automation, which helps teams avoid getting stuck doing the same repetitive tasks over and over. NinjaOne also ties monitoring together with backup, patching, remote access, and documentation tools, making it feel more like a full operational hub than a monitoring add on. For teams that need something practical and easy to work with, especially in distributed or hybrid workplaces, their approach tends to fit pretty naturally.

Key Highlights:

  • Focuses on endpoint and device monitoring rather than traditional node checks
  • Built in automations to reduce repetitive IT work
  • Combines monitoring, patching, backup, and remote access in one platform
  • Fits well for remote, hybrid, or multi location environments
  • Designed to simplify routine IT operations

Services:

  • Endpoint and device monitoring
  • Patch management and automation
  • Remote access and troubleshooting
  • Backup and recovery tools
  • Documentation and ticketing support
  • Onboarding help and customer support

Contact Information:

  • Website: www.ninjaone.com
  • Email: sales@ninjaone.com
  • Phone: +1 888 542-8339
  • Address: 301 Congress Ave, 4th Floor Austin, TX 78701 USA
  • LinkedIn: www.linkedin.com/company/ninjaone
  • Twitter: x.com/ninjaone
  • Instagram: www.instagram.com/ninjaone
  • Facebook: www.facebook.com/NinjaOne

12. Atatus

Atatus takes a more modern route than what people are used to with Nagios. Instead of relying on lots of manual setup or extra plugins, they try to give teams a single place to watch everything happening across their applications, infrastructure, and users. Their platform is built around real time visibility, so developers and ops teams can spot slowdowns or errors without digging through multiple tools. It’s designed for environments where things change fast and teams want a smoother, cleaner experience than the old school monitoring stack.

They also put a lot of effort into keeping the interface simple enough that anyone on the team can make sense of it. Dashboards come ready to use, and most of the heavy lifting happens behind the scenes. Because Atatus covers metrics, logs, traces, and user experience in one place, teams don’t have to jump between different systems just to understand what broke. It’s a more unified approach that fits well for companies that want something modern without dealing with the usual overhead.

Key Highlights:

  • Unified monitoring for applications, infrastructure, logs, and user experience
  • Minimal setup compared to traditional tools
  • Real time visibility with clear dashboards
  • Strong focus on usability and smooth workflows
  • Designed for modern DevOps and engineering teams

Services:

  • Infrastructure monitoring for servers, containers, and cloud resources
  • Application performance monitoring
  • Real user monitoring for frontend performance
  • Log management and correlation tools
  • Error tracking and alerting
  • Setup help and platform support

Contact Information:

  • Website: www.atatus.com
  • Email: success@atatus.com
  • Phone: +1-760-465-2330
  • Address: No.51, 2nd Floor, IndiQube Alpine, Labour Colony, SIDCO Industrial Estate, Ekkatuthangal, Guindy, Chennai, India – 600032
  • LinkedIn: www.linkedin.com/company/atatus
  • Twitter: x.com/atatusapp
  • Instagram: www.instagram.com/atatusapp
  • Facebook: www.facebook.com/Atatus

13. Sumo Logic

Sumo Logic leans heavily into logs and security analytics, which gives it a very different personality compared to something like Nagios. Instead of focusing on checks and simple alerts, they work more on turning huge amounts of log data into something teams can actually use. Their platform is built for cloud environments where everything moves fast and there’s way too much data for a person to sort through manually. So they try to help teams make sense of all that noise, whether it’s for troubleshooting, monitoring, or tracking down security issues.

They also put a lot of emphasis on automation, especially around incidents. The idea is that teams shouldn’t have to chase every single alert by hand if the system can group related issues or filter out the ones that don’t matter. Sumo Logic fits well for companies that already rely on cloud services and want a tool that keeps up with that scale. Instead of stitching together lots of plugins, they bring everything into one platform and let you dig into logs, metrics, and security data without jumping through hoops.

Key Highlights:

  • Strong focus on log analytics and cloud era monitoring
  • Built in automations for alert investigation
  • Unified platform covering reliability, security, and troubleshooting
  • Works well across cloud and hybrid environments
  • Supports many integrations out of the box

Services:

  • Log collection and analysis
  • Cloud SIEM and security analytics
  • Infrastructure and application monitoring
  • Incident investigation and alert correlation
  • Querying, dashboards, and reporting tools
  • Support and onboarding resources

Contact Info:

  • Website: www.sumologic.com
  • Email: sales@sumologic.com
  • Phone: +1 650-810-8700
  • Address: 3600 Glenwood Ave., Suite 320 Raleigh, NC 27612
  • LinkedIn: www.linkedin.com/company/sumo-logic
  • Twitter: x.com/SumoLogic
  • Facebook: www.facebook.com/Sumo.Logic

14. Sensu

Sensu takes a very different route from the old Nagios style of monitoring. Instead of relying on static checks and a lot of manual setup, they treat monitoring more like an extension of your infrastructure code. Their platform is built around the idea that everything in modern environments is constantly moving around, scaling up, scaling down, or changing shape entirely. Because of that, they focus on creating a pipeline where teams can define checks, filters, and workflows in code and let the system handle the rest. It’s a setup that tends to click with teams already working in containerized or multi cloud setups.

They also make it easy to bring together different monitoring tools you might already have. Sensu sits in the middle and helps unify data from metrics, logs, traces, and even older tools like Nagios plugins. The goal isn’t to throw everything out and start fresh, but to give teams a more flexible way to automate alerts, auto register new services, and keep up with environments that change a little too fast for manual dashboards.

Key Highlights:

  • Built around monitoring as code
  • Works well with dynamic, multi cloud environments
  • Supports existing Nagios plugins and other monitoring tools
  • Automates registration and de registration of services
  • Acts as an observability pipeline that ties metrics, logs, and traces together

Services:

  • Observability pipeline setup and management
  • Monitoring as code configuration
  • Integration with Nagios, Prometheus, StatsD, Telegraf, and more
  • Infrastructure and service auto discovery
  • Alerting, filtering, and workflow automation
  • Documentation, community support, and onboarding resources

Contact Information:

  • Website: sensu.io
  • Address: 305 Main Street Redwood City, CA 94063 USA
  • Twitter: x.com/sensu

15. Dotcom-Monitor

Dotcom-Monitor takes a very different approach from traditional tools like Nagios. Instead of only checking whether a server responds, they focus on how real users actually experience a site or application. Their platform leans heavily on real-browser testing, stepping through things like logins, carts, and checkout flows, which makes it easier to catch issues that basic uptime pings would never reveal. Teams that rely on user journeys or complex front-end behavior tend to use Dotcom-Monitor when they want something more practical and less manual than plugin-heavy setups.

They also cover the quieter parts of monitoring that often get ignored, like SSL, DNS, and deep API checks. Everything sits in one place, and the workflow feels more like troubleshooting with clear visuals rather than digging through logs trying to piece things together. For teams looking for a Nagios alternative that deals with modern web performance and reliability challenges, Dotcom-Monitor ends up filling those gaps without asking people to rebuild their monitoring from scratch.

Key Highlights:

  • Real-browser monitoring for full user journeys
  • Covers web apps, uptime, APIs, SSL, and DNS in one platform
  • Visual diagnostics like waterfalls and screenshots for faster troubleshooting
  • Monitors from many global locations for regional insight
  • Useful for teams with complex, front-end heavy applications

Services:

  • Website and web application monitoring
  • Transaction and user journey monitoring
  • API monitoring and validation
  • SSL certificate checks
  • DNS monitoring and availability checks
  • Alerting and diagnostics with integrations for common incident tools

Contact Information:

  • Website: www.dotcom-monitor.com
  • Email: sales@dotcom-monitor.com
  • Phone: 1-888-479-0741
  • Address: 2500 Shadywood Rd, Excelsior, MN 55331 USA
  • LinkedIn: www.linkedin.com/company/dotcom-monitor
  • Twitter: x.com/dotcom_monitor
  • Facebook: www.facebook.com/dotcommonitor

Conclusion

Looking at the tools that have grown up around the monitoring space, it’s pretty clear that teams aren’t working the same way they did back when Nagios was the default choice. Some companies lean into full observability platforms, others focus on automation, and a few try to make monitoring feel less like a chore and more like something that quietly supports the work in the background. There’s no single path that fits everyone, and that’s actually the upside.

Whether you’re after deeper visibility, easier setup, or something that doesn’t require maintaining a pile of custom scripts, there are solid options at every level. The easiest way to figure out what sticks is to test one or two tools with a small slice of your environment. You’ll know pretty quickly which ones reduce noise and which ones just add more moving parts. And once you find a setup that lets your team focus on real work instead of babysitting alert configs, it tends to become the new normal without much debate.


Top AWS CloudFormation Alternatives for Scalable Infrastructure

CloudFormation is fine until it isn’t. Once teams start juggling multi-cloud setups, heavier automation needs, or faster deployment cycles, the tool can feel a bit limiting. That’s usually when the search for something more flexible or developer-friendly begins.

In this guide, we’ll take a closer look at the alternatives that have stepped up in this space. Some lean into easier templating, others focus on deeper automation, and a few simply remove the friction CloudFormation tends to introduce. More importantly, we’ll highlight the companies behind these tools, the ones helping teams build cleaner infrastructure without the extra noise. This isn’t about finding a magic replacement, but about understanding which direction fits the way your team actually works. Let’s break it down.

1. AppFirst

AppFirst takes a pretty different approach compared to CloudFormation and most traditional IaC tools. Instead of asking teams to define every piece of infrastructure line by line, they flip it around and let developers describe what the app actually needs. From there, the platform assembles the whole setup automatically. It appeals to teams that want the benefits of IaC without the long trail of Terraform files, YAML, reviews, refactors, and everything else that usually piles up when apps scale.

They also lean into the idea of staying cloud-agnostic, which is handy when people don’t want their infrastructure templates tied too tightly to one provider. AppFirst handles the security defaults, the networking bits, the logs, the monitoring, and all the internal wiring that normally eats up half a sprint. It’s a different kind of alternative to CloudFormation, but for teams that want to reduce IaC overhead instead of expanding it, it ends up filling a gap nicely.

Key Highlights:

  • Application-first approach instead of writing infrastructure code
  • Works across AWS, Azure, and GCP
  • Provides built-in logging, monitoring, and auditing
  • Standardizes security and cloud best practices automatically
  • Offers SaaS and self-hosted deployment options

Services:

  • Automated infrastructure provisioning
  • Cross-cloud deployment support
  • Security and compliance enforcement
  • Cost visibility and audit logs
  • Built-in observability tools
  • App-focused configuration workflows

Contact Info:

2. Pulumi

Pulumi comes up a lot whenever people start looking for something more flexible than CloudFormation. They take a pretty straightforward approach to infrastructure as code by letting teams work in normal programming languages instead of dealing with long YAML files. Most folks use it when they want their infrastructure to feel like part of their actual software workflow instead of a separate world they only touch when something breaks. Pulumi also brings everything into one place, so teams can manage code, secrets, policies, and automation without juggling a bunch of disconnected tools.

They also lean heavily into making day-to-day tasks less painful. Engineers can test code, reuse components, and work in the same languages they already use for their apps. On top of that, they’ve built extra tools for things like centralizing secrets, keeping an eye on multi-cloud setups, and giving teams a clearer path to build internal platforms. Their newer AI features add another layer, helping automate some of the routine work without getting in the way.

Key Highlights:

  • Uses real programming languages for infrastructure
  • Works across multiple cloud providers
  • Includes built-in tools for secrets, config, and policy control
  • Offers AI features to automate common tasks
  • Supports internal platform building and reusable components

Services:

  • Infrastructure as code tooling
  • Multi-cloud resource management
  • Secrets and configuration management
  • Policy and governance features
  • AI-driven infrastructure automation
  • Internal developer platform support

Contact Information:

  • Website: www.pulumi.com
  • Address: 601 Union St., Suite 1415 Seattle, WA 98101 USA
  • LinkedIn: www.linkedin.com/company/pulumi
  • Twitter: x.com/pulumicorp

3. Terraform

Terraform is usually one of the first names people bring up when they want something more flexible than CloudFormation. They focus on describing infrastructure in a simple config language so teams can manage resources across different clouds the same way. Most folks use it when they want a single workflow instead of juggling AWS-specific templates and separate tools for everything else. Terraform also fits well into larger engineering setups because it works with a wide range of providers, not just the major clouds.

They put a lot of effort into helping teams handle more than just basic provisioning. Their ecosystem includes tools for building consistent images, managing policies, and coordinating multi-cloud setups. The whole idea is to treat infrastructure as something that can be planned, tracked, and changed with fewer surprises. It’s not meant to replace engineering effort, just make the work less scattered.

Key Highlights:

  • Lets teams manage infrastructure using a single config language
  • Works across cloud providers and many external services
  • Supports team workflows through versioning and planning
  • Large ecosystem of integrations and reusable configurations
  • Can be paired with other HashiCorp tools for broader workflows

Services:

  • Infrastructure as code tooling
  • Multi-cloud provisioning
  • Team collaboration features
  • Policy and configuration management
  • Image and environment provisioning via related tools
  • Support for automation and CI workflows

Contact Information:

  • Website: www.hashicorp.com
  • Address: 101 2nd Street, Suite 700 San Francisco, California, 94105 USA
  • LinkedIn: www.linkedin.com/company/hashicorp
  • Twitter: x.com/hashicorp
  • Facebook: www.facebook.com/HashiCorp

4. env0

env0 often comes up when teams hit the limits of CloudFormation and need something that can manage Terraform or other IaC tools in a cleaner, more predictable way. Instead of relying on CloudFormation’s AWS-only workflow, env0 gives teams a central place to run their infrastructure pipelines across different clouds and environments. It helps keep everything consistent, so deployments don’t depend on whatever script or shortcut someone used last month. For teams juggling Terraform stacks or shifting away from CloudFormation templates, this kind of structure makes day-to-day work less chaotic.

They also deal with a lot of the rough edges that show up once IaC gets bigger. env0 adds guardrails, review steps, and visibility that CloudFormation alone doesn’t really cover. Teams can see what’s being deployed, catch issues earlier, and rely on one shared workflow instead of dozens of separate processes. The idea isn’t to replace Terraform or OpenTofu, but to sit on top of them and keep the whole operation organized while still letting engineers work the way they prefer.

Key Highlights:

  • Helps teams move beyond AWS-only CloudFormation workflows
  • Standardizes IaC processes for Terraform and other tools
  • Supports Git-based reviews and predictable pipelines
  • Adds guardrails like RBAC and policy checks
  • Improves visibility into deployments and environment changes

Services:

  • IaC workflow automation
  • Multi-environment and multi-account coordination
  • Governance and policy management
  • Cost oversight and usage controls
  • Self-service deployment features
  • Integrations for Terraform and related IaC tools

Contact Information:

  • Website: www.env0.com
  • Address: 100 Causeway Street, Suite 900, Boston, MA 02114 United States 
  • LinkedIn: www.linkedin.com/company/env0
  • Twitter: x.com/envzero

5. Spacelift

Spacelift shows up on the radar for teams that have outgrown CloudFormation’s way of doing things and want something that handles modern IaC workflows without locking them into one cloud. Instead of writing long CloudFormation templates and manually wiring everything into a pipeline, Spacelift gives teams a central place to run Terraform, OpenTofu, Ansible, and other tools they already rely on. It’s the kind of setup people look for when they want more flexibility and a cleaner path to manage multi-cloud or mixed-infrastructure environments.

They also tackle a few of the problems that come up when CloudFormation becomes a bottleneck. With Spacelift, deployments follow the same workflow every time, reviews are easier to manage, and changes are more visible across teams. Developers can spin up things through a controlled process, while platform teams still keep the guardrails in place. It’s not trying to replace IaC tools themselves, but it sits on top and helps organize everything they’re doing.

Key Highlights:

  • Built to support Terraform, OpenTofu, Ansible, and other CloudFormation alternatives
  • Helps teams move away from AWS-only pipelines
  • Standardizes IaC workflows across clouds and environments
  • Adds policies, drift checks, and visibility CloudFormation doesn’t cover well
  • Makes self-service possible while keeping platform teams in control

Services:

  • IaC orchestration for Terraform, OpenTofu, CloudFormation, and more
  • Automated workflows for provisioning and configuration
  • Policy and access controls for safer deployments
  • Drift detection and environment tracking
  • Multi-cloud and multi-environment management
  • Self-hosted and SaaS deployment options

Contact Information:

  • Website: spacelift.io
  • Email: info@spacelift.io
  • Address: 541 Jefferson Ave. Suite 100 Redwood City CA 94063 USA
  • LinkedIn: www.linkedin.com/company/spacelift-io
  • Twitter: x.com/spaceliftio
  • Facebook: www.facebook.com/spaceliftio

6. Chef

Chef is often considered when teams want an alternative to CloudFormation that goes beyond template-driven provisioning and gives them more control over how servers and configurations are managed over time. Instead of defining everything in long JSON or YAML documents, Chef uses policy-as-code to keep infrastructure consistent across cloud and on-prem environments. Teams look at it when they need something flexible enough to manage configuration, compliance, and workflows in one place, especially if they’re mixing AWS with other platforms.

They also focus on the ongoing lifecycle of infrastructure, which is something CloudFormation doesn’t really cover well. Chef lets teams automate configuration, enforce standards, and run audits through repeatable policies rather than relying on manual fixes or ad hoc scripts. It fits into setups where people want more day-to-day control and want to avoid drift, while still keeping their systems aligned with the rules and processes their organization depends on.

Key Highlights:

  • Supports policy-as-code as an alternative to CloudFormation templates
  • Helps manage configuration, compliance, and workflows across environments
  • Works across AWS, cloud, hybrid, and on-prem setups
  • Provides guardrails through repeatable policies and audits
  • Designed for long-term infrastructure consistency, not just provisioning

Services:

  • Infrastructure configuration management
  • Compliance and security policy enforcement
  • Workflow and job orchestration
  • Application and node management
  • Support for cloud, hybrid, and on-prem environments

Contact Information:

  • Website: www.chef.io
  • LinkedIn: www.linkedin.com/company/chef-software
  • Twitter: x.com/chef
  • Instagram: www.instagram.com/chef_software
  • Facebook: www.facebook.com/getchefdotcom

ansible

7. Ansible

Ansible is one of the tools teams look at when CloudFormation starts feeling too tied to AWS and not flexible enough for everything else they need to manage. Instead of writing long CloudFormation templates, Ansible uses simple YAML playbooks that describe the state you want your systems to be in. They lean into automation and configuration management rather than just provisioning, which makes Ansible useful when teams need something that works across clouds, on-prem machines, network devices, or whatever else is in the mix.

They also keep things pretty straightforward by running without agents and relying on standard connections like SSH. This helps teams manage a lot of day-to-day tasks that CloudFormation doesn’t cover, like patching, updating configs, and keeping servers consistent over time. It fits well in setups where infrastructure needs regular adjustments and automation, and where people want a tool that can handle changes across different environments without locking them into AWS’s way of doing things.

Key Highlights:

  • Uses simple YAML playbooks instead of CloudFormation templates
  • Works across cloud, on-prem, and hybrid environments
  • Agent-less design that reduces setup and maintenance
  • Helps automate ongoing configuration and system changes
  • Supports a wide range of operating systems and platforms

Services:

  • Configuration management and automation
  • Playbook-driven provisioning
  • Software deployment and updates
  • Zero-downtime rolling updates
  • Multi-environment and multi-platform support

Contact Information:

  • Website: docs.ansible.com 

8. Salt Project

Salt is one of the tools people look at when CloudFormation feels too tied to AWS and not flexible enough for everything happening across their infrastructure. Instead of relying on templates, Salt leans on automation, remote execution, and configuration management to handle systems at scale. They use a data-driven approach that lets teams push changes out quickly and keep machines aligned with whatever state they’re supposed to be in, whether that’s on AWS, on-prem, or somewhere in between. It’s the kind of tool teams consider when they need something that can react fast and manage a lot of moving pieces at once.

They also focus heavily on ongoing operations, not just provisioning. Salt gives teams a way to run commands across large fleets, automate routine fixes, and enforce configuration standards without jumping between different tools. For people moving away from CloudFormation, Salt often ends up being the part that handles the day-to-day management work that a template-based system doesn’t cover. It’s useful when infrastructure needs constant updates and you want a system that can automate those tasks without turning everything into a manual effort.

Key Highlights:

  • Works across cloud, on-prem, and hybrid environments
  • Uses automation and remote execution instead of static templates
  • Helps keep systems aligned with defined states
  • Supports fast, large-scale configuration changes
  • Useful for teams needing more operational control than CloudFormation provides

Services:

  • Configuration management
  • Remote execution and orchestration
  • System state enforcement
  • Multi-environment automation
  • Support for cloud, hybrid, and on-prem setups

Contact Information:

  • Website: saltproject.io
  • LinkedIn: www.linkedin.com/company/saltproject
  • Twitter: x.com/Salt_Project_OS
  • Instagram: www.instagram.com/saltproject_oss
  • Facebook: www.facebook.com/SaltProjectOSS

9. OpenTofu

OpenTofu is usually mentioned when teams want to step away from CloudFormation and move toward something more flexible without losing the familiar Terraform workflow. Since it’s a community-driven fork of Terraform, it works as a drop-in replacement, which makes it easier for teams to switch without rewriting everything. They focus on keeping IaC open-source and giving engineers the same style of configuration they’re used to, just without the licensing concerns that pushed many people to look for alternatives in the first place.

They also add a few extra features that help with the things CloudFormation doesn’t cover well, like managing multi-cloud setups, organizing modules, and giving teams more control over how resources get deployed. OpenTofu keeps the same provider ecosystem as Terraform, so teams can use it to build and manage infrastructure across different clouds while moving away from AWS-only templates. It fits into workflows where people want IaC that feels familiar but gives them more long-term stability and freedom.

Key Highlights:

  • Works as a Terraform-compatible alternative to CloudFormation
  • Fully open-source and community-driven
  • Supports multi-cloud and multi-environment configurations
  • Compatible with a large provider and module ecosystem
  • Adds features like resource exclusion, state encryption, and advanced provider patterns

Services:

  • Infrastructure as code configuration
  • Multi-cloud resource deployment
  • State management and encryption
  • Module and provider support
  • Git-based workflows and version control integration

Contact Information:

  • Website: opentofu.org
  • Twitter: x.com/opentofuorg

10. Crossplane

Crossplane is something teams pick up when CloudFormation starts feeling too limited or too AWS-shaped for the kind of platforms they want to build. Instead of relying on templates that only describe resources, Crossplane lets them create their own APIs on top of Kubernetes. That means they can define infrastructure in a more modular way and expose it to developers without making everyone learn the low-level details of each cloud provider. For teams that want to build a consistent experience across clouds, or even just keep AWS a bit more organized, this approach gives them more room to design things the way they want.

They also focus heavily on the idea of running infrastructure through a control plane rather than a one-off provisioning tool. Crossplane plugs into Kubernetes, so everything becomes declarative, version controlled, and easy to extend. Instead of treating infrastructure as a set of isolated pieces, teams can stitch together policies, permissions, and resource definitions into one cohesive workflow. For anyone moving away from CloudFormation, it’s appealing because it offers a lot of flexibility while still keeping the overall process predictable.

Key Highlights:

  • Lets teams build custom APIs as an alternative to CloudFormation templates
  • Works across multiple cloud providers through a Kubernetes control plane
  • Supports declarative workflows for consistent infrastructure management
  • Integrates naturally with cloud native tools and Kubernetes features
  • Helps platform teams design their own opinionated infrastructure layers

Services:

  • Custom control plane creation
  • Multi-cloud resource orchestration
  • Policy and permission management
  • Declarative configuration workflows
  • Kubernetes-based extension and integration

Contact Information:

  • Website: www.crossplane.io
  • Email: info@crossplane.io
  • LinkedIn: www.linkedin.com/company/crossplane
  • Twitter: x.com/crossplane_io

11. Northflank

Northflank is one of those platforms teams look at when CloudFormation starts feeling a bit too tied to AWS and not great for running workloads across different clouds. Instead of asking engineers to deal with the usual maze of YAML, cloud consoles, and pipeline stitching, Northflank gives them a single place to deploy and manage apps, databases, and jobs across whatever cloud they already use. They lean into this idea of bringing your own cloud, so teams can stay on AWS if they want, or mix in GCP, Azure, or on-prem without rebuilding their setup from scratch.

They also handle a lot of the operational work people usually end up scripting around when moving away from CloudFormation. Things like workload automation, preview environments, pipelines, failover, and cluster lifecycle management all get baked into one platform. Teams use it when they want the freedom to run things wherever it makes sense but still keep a consistent developer experience. It ends up acting like the missing layer between cloud resources and day-to-day engineering workflows, especially for groups that want less infrastructure busywork and more focus on shipping code.

Key Highlights:

  • Works across AWS, GCP, Azure, on-prem, and hybrid setups
  • Offers a unified workflow instead of relying on CloudFormation templates
  • Provides consistent deployment and management across clouds
  • Supports GitOps, pipelines, preview environments, and autoscaling
  • Simplifies Kubernetes operations through BYOC and BYOK

Services:

  • Multi-cloud workload deployment
  • Kubernetes cluster lifecycle management
  • Application, database, and job hosting
  • Automated pipelines and GitOps workflows
  • Failover and disaster recovery tools
  • Internal developer platform capabilities

Contact Information:

  • Website: northflank.com
  • Email: contact@northflank.com
  • Address: 20-22 Wenlock Road, London, England, N1 7GU
  • LinkedIn: www.linkedin.com/company/northflank
  • Twitter: x.com/northflank

12. Puppet

Puppet shows up in conversations about CloudFormation alternatives mainly because they take a different angle on the whole infrastructure problem. Instead of focusing on how to create resources, they lean into keeping everything in the state it should be. Their approach tends to make more sense for teams that care about long-term consistency across fleets of servers or hybrid setups, rather than just spinning up cloud resources and walking away. A lot of what they do is about turning configuration work into code and letting the system enforce those rules automatically, which can feel like a big relief compared to chasing drift by hand.

They also fit into workflows where CloudFormation starts to feel a bit narrow. Puppet plays well across different environments, not just AWS, and their model suits teams that want a central source of truth for how systems should behave. Whether it is operating systems, app configs, or a mix of on-prem and cloud machines, Puppet gives teams a way to define everything once and let automation do the repetitive work. It is a different style of IaC, but in many organizations it ends up filling in gaps CloudFormation doesn’t try to solve.

Key Highlights:

  • Focuses on configuration management rather than cloud-specific provisioning
  • Helps maintain consistent state across servers and environments
  • Useful in hybrid and multi-cloud setups
  • Emphasizes version-controlled, repeatable infrastructure practices
  • Supports modeling infrastructure as code with a declarative language

Services:

  • Configuration management and enforcement
  • Infrastructure as code workflows
  • Policy and compliance automation
  • Orchestration for tasks and deployments
  • Integration with CI/CD and monitoring tools

Contact Information:

  • Website: www.puppet.com
  • Email: sales-request@perforce.com
  • Phone: +1 612.517.2100
  • Address: 400 First Avenue North #400 Minneapolis, MN 55401 USA

13. Google Cloud Deployment Manager

Google Cloud’s Deployment Manager comes up pretty often when teams are looking for alternatives to CloudFormation, mostly because it gives them a similar declarative way to define infrastructure but without locking everything into AWS. Instead of writing long lists of steps, they describe what the final setup should look like, and Deployment Manager figures out how to make it happen across Google Cloud services. It tends to appeal to teams that want structure but also like being able to break things into reusable templates instead of rewriting the same config for every project.

They also lean heavily into templating, which lets teams build out complex setups without drowning in YAML. People can mix Python or Jinja with their configuration files, which makes tweaking things for different environments a bit easier. It slots comfortably into the usual IaC routine version control, code reviews, repeatable deployments and gives teams a predictable way to manage GCP resources when CloudFormation isn’t an option or when they’re running multi-cloud setups.

Key Highlights:

  • Declarative IaC approach focused on Google Cloud resources
  • Uses templates to structure and reuse configurations
  • Supports YAML with Jinja or Python templates for flexibility
  • Works well with Git-based workflows
  • Lets teams manage deployments consistently across environments

Services:

  • Infrastructure provisioning and updates
  • Template-based resource definitions
  • Multi-environment configuration management
  • Integration with gcloud CLI and API
  • Version-controlled IaC workflows

Contact Information:

  • Website: cloud.google.com
  • LinkedIn: www.linkedin.com/showcase/google-cloud
  • Twitter: x.com/googlecloud
  • Instagram: www.instagram.com/googlecloud
  • Facebook: www.facebook.com/googlecloud

Conclusion

Looking at CloudFormation alternatives makes one thing pretty clear: teams have a lot more freedom now than they did a few years ago. Some tools stick close to the traditional IaC model, others build whole platforms on top of it, and a few try to remove infrastructure work from developers almost entirely. There isn’t one perfect path here, just different ways to lighten the load depending on how your team likes to work.

If you’re trying to figure out what fits, the easiest move is to test a couple of options on a small, low-risk project. You’ll quickly feel which approach matches your workflow and which one adds friction. And once you find a tool that actually makes deployments less of a headache, it tends to become part of the routine without much debate.


Top Docker Swarm Alternatives: Elevate Your Cloud Infrastructure

Docker Swarm was a go-to option for container orchestration when it first came on the scene, but let’s be honest as your business scales, so do your needs. While it still does the job, there are newer, more flexible solutions out there that might be a better fit for your growing operations. In this article, we’ll explore some of the top Docker Swarm alternatives that offer more power, flexibility, and scalability. Whether you’re a startup or a large enterprise, there’s a solution here that can help keep your deployment on track and moving forward. Let’s dive in.
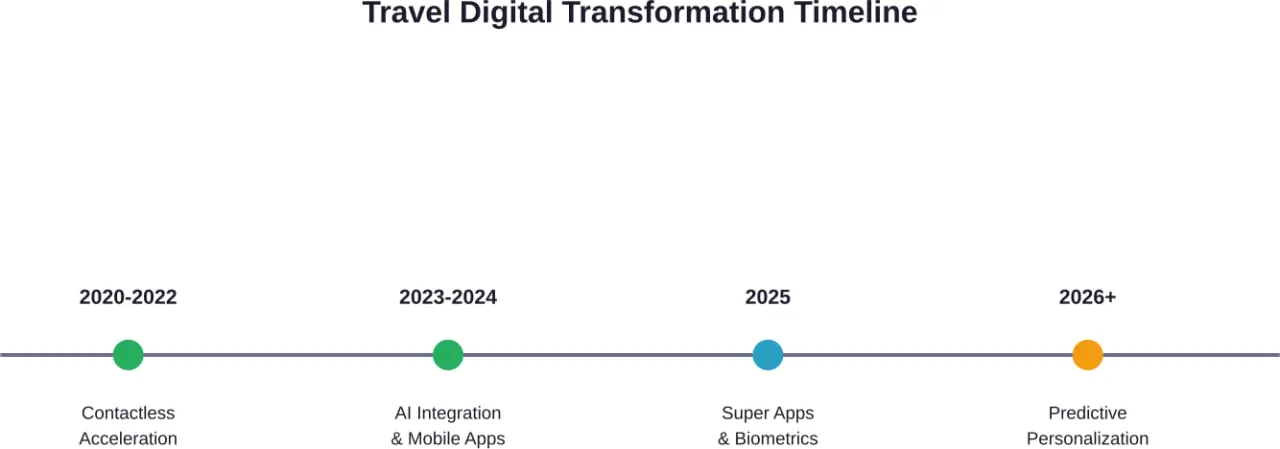
1. AppFirst

AppFirst takes a pretty different angle compared to most platforms in the infrastructure space. Instead of asking teams to learn Terraform, compare cloud services, or untangle long YAML files, they flip the whole thing around. Their idea is that developers should only have to describe what an app needs, and the platform will figure out the infrastructure behind the scenes. It’s a simple pitch, but you can see why a lot of teams gravitate toward it when they’re tired of maintaining homegrown tooling or answering the same infra questions over and over.

They also focus a lot on helping companies keep things consistent without slowing anyone down. Since they handle the provisioning layer, every app gets the same baseline for security, logging, monitoring, networking, and all the other things that normally vary from team to team. The appeal is basically this: teams ship faster, and nobody has to rebuild a platform from scratch. Whether a company works in AWS, Azure, or GCP, the workflow stays the same, which saves people from relearning everything when environments change.
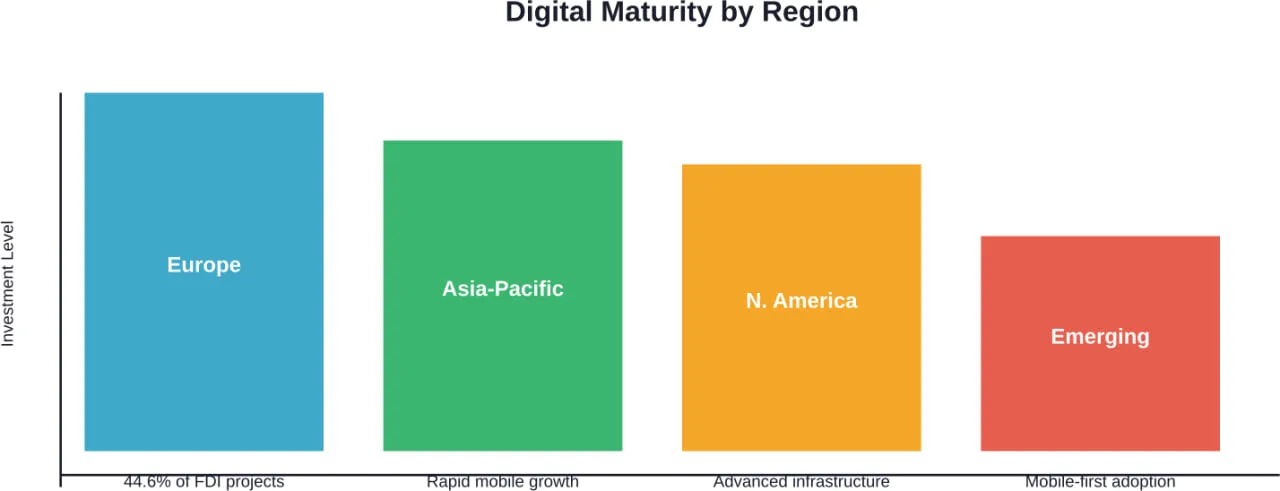
Key Highlights:

  • Lets teams define app requirements without writing infrastructure code
  • Handles security, networking, and cloud best practices automatically
  • Works across AWS, Azure, and GCP with the same workflow
  • Offers visibility into costs and infrastructure changes
  • Can run as SaaS or as a self-hosted setup

Services:

  • Automatic infrastructure provisioning for cloud workloads
  • Built-in logging, monitoring, and alerting
  • Managed security configuration and compliance controls
  • Cross-cloud application deployment and abstraction
  • Centralized auditing and cost tracking
  • Self-hosted deployment option for teams with tighter requirements

Contact Info:

2. Nomad by HashiCorp

Nomad is a flexible and simple tool designed for orchestrating containers, binaries, and batch jobs. Whether it’s for applications running in the cloud or on-prem, it makes managing large-scale deployments less of a headache. Unlike some other orchestrators that can be a bit too heavy for smaller setups, Nomad is built to scale, from small environments to enterprise-grade infrastructures, without overwhelming users with unnecessary complexity. It’s a great fit for teams looking for something that’s straightforward but still offers the power needed for growing operations.

What sets Nomad apart is its ability to handle both containerized and non-containerized workloads, giving teams the flexibility to mix and match based on their needs. It integrates seamlessly with other HashiCorp tools, like Terraform and Vault, making it a solid choice for businesses already working with those solutions. It also offers features like traffic encryption, access control, and job resiliency to ensure everything runs smoothly, even during unexpected disruptions.

Key Highlights:

  • Flexible for both containerized and non-containerized applications
  • Integrates with HashiCorp tools (Terraform, Vault, Consul)
  • Scales easily from small to large environments
  • Offers features like job resiliency and traffic encryption
  • Simple to use with a focus on reducing complexity

Services:

  • Container orchestration
  • Job scheduling
  • Cluster management
  • Integration with Terraform, Vault, and Consul
  • Resilient job management and recovery
  • Security features like traffic encryption and access control

Contact Information:

  • Website: www.hashicorp.com
  • Address: 101 2nd Street, Suite 700 San Francisco, California, 94105 USA
  • LinkedIn: www.linkedin.com/company/hashicorp
  • Twitter: x.com/hashicorp
  • Facebook: www.facebook.com/HashiCorp

3. Red Hat

Red Hat is well known for offering a flexible, enterprise-ready hybrid cloud platform that makes managing complex systems much more streamlined. Their focus is on creating a consistent and scalable environment for containerized applications. With Red Hat OpenShift, businesses can manage their containers, applications, and services across on-premise and cloud-based infrastructure, all while ensuring security and reliability. The platform works seamlessly with Kubernetes and is built with a developer-first mindset, enabling easy integration with existing workflows, and providing a foundation for developers to quickly build and scale their applications.

Red Hat’s approach is all about flexibility and collaboration. It gives organizations the tools to automate their workflows, maintain control over the entire lifecycle of their applications, and ensure seamless integration across different environments. With their extensive open-source contributions and a large community of developers, Red Hat’s solutions are trusted by many large-scale enterprises to keep their systems secure, efficient, and adaptable to growing business needs.

Key Highlights:

  • Hybrid cloud solutions for both containerized and virtualized applications
  • Seamless integration with Kubernetes and other HashiCorp tools
  • Developer-friendly workflows and built-in CI/CD pipelines
  • Offers automatic platform updates and upgrades
  • Provides centralized policy management across multiple teams

Services:

  • Container orchestration with Red Hat OpenShift
  • Automated platform updates and cloud management
  • Kubernetes integration and management
  • Cloud-native application deployment and scaling
  • Security management and policy enforcement
  • Hybrid cloud consulting and support services

Contact Information:

  • Website: www.redhat.com
  • Email: apac@redhat.com
  • Phone: 8887334281
  • Address: 100 E. Davie Street Raleigh, NC 27601, USA
  • LinkedIn: www.linkedin.com/company/red-hat
  • Twitter: x.com/RedHat
  • Facebook: www.facebook.com/RedHat

4. Rancher

Rancher is a tool designed to make Kubernetes management a bit easier. It’s a platform that lets you deploy and manage Kubernetes clusters anywhere whether that’s in the cloud or on-premises without needing to dive into the weeds. One of the key things Rancher does is centralize the management of multiple Kubernetes clusters, which can be a huge time-saver. It simplifies things like authentication, access control, and monitoring, making it a solid choice for teams working with Kubernetes at scale. Plus, Rancher gives you the flexibility to integrate with other systems, so you can make it fit into your existing setup without much hassle.

What’s nice about Rancher is that it’s not just about deployment. It’s about keeping everything running smoothly once it’s up and running. The platform offers built-in monitoring and alerting for clusters, integrates with CI/CD systems (or has its own tools), and helps you manage your workloads automatically. If you’re looking for something that can keep everything in check across multiple Kubernetes environments, Rancher can take the load off your shoulders without adding too much complexity.

Key Highlights:

  • Centralized management for multiple Kubernetes clusters
  • Simplifies authentication and role-based access control (RBAC)
  • Built-in monitoring, alerting, and log management
  • Easy integration with external CI/CD systems or Rancher’s Fleet
  • Supports both cloud and on-premises environments

Services:

  • Kubernetes cluster management
  • Monitoring and alerting for clusters and resources
  • Access control and authentication management
  • CI/CD integration
  • Automatic workload deployment and upgrades via Fleet

Contact Information:

  • Website: www.rancher.com
  • LinkedIn: www.linkedin.com/company/rancher
  • Twitter: x.com/Rancher_Labs
  • Facebook: www.facebook.com/rancherlabs

5. Mirantis

Mirantis is a company that makes it easier to manage complex cloud and AI infrastructures. Their main focus is on providing a smooth way to run Kubernetes clusters across various environments, including on-prem, hybrid, and cloud setups. What’s great about Mirantis is that they’ve really honed in on simplifying the process of managing AI workloads, which can often be a headache. Whether it’s providing infrastructure as a service or automating the lifecycle of AI models, they’ve got tools like k0rdent to streamline the whole process from bare metal to running models in production. For organizations looking to build and manage AI platforms with minimal friction, Mirantis’ solutions are a solid option.

Mirantis is also big on helping companies modernize their applications. They offer a bunch of tools to automate infrastructure, reduce costs, and ensure that everything runs smoothly. From AI PaaS to GPU cloud solutions, their platform supports a variety of use cases, particularly around AI and machine learning. It’s not just about managing workloads; Mirantis wants to make the entire process from setup to scaling easy and efficient. Whether you’re migrating workloads or enhancing your cloud-native capabilities, Mirantis has a comprehensive toolkit for managing the tech that powers modern businesses.

Key Highlights:

  • Simplifies AI workload management across different environments
  • Offers infrastructure automation from bare metal to cloud
  • Focuses on streamlining the deployment and scaling of AI models
  • Integrates seamlessly with various cloud-native tools and ecosystems
  • Provides a variety of services for workload migration and application modernization

Services:

  • AI infrastructure and services automation
  • Kubernetes management and orchestration
  • Infrastructure-as-a-Service (IaaS) and GPU PaaS
  • Application modernization and cloud-native solutions
  • Enterprise-level support and consulting
  • Workload migration and management

Contact Information:

  • Website: www.mirantis.com
  • Phone: +1-650-963-9828
  • Address: 900 E Hamilton Avenue Suite 650Campbell, CA 95008 USA
  • LinkedIn: www.linkedin.com/company/mirantis
  • Twitter: x.com/MirantisIT
  • Facebook: www.facebook.com/MirantisUS

6. Cloud Run by Google Cloud

Cloud Run is Google’s answer to simplifying app deployment and management. It allows developers to build and run applications in containers without worrying about the underlying infrastructure. Whether it’s a web app, backend service, or an API, Cloud Run can take care of the deployment, scaling, and management, automatically handling scaling to zero when there’s no traffic. This means you don’t pay for idle time, which is a huge win if you’re running variable or event-driven workloads. It’s a serverless platform, so developers can just focus on the code and let Cloud Run handle the heavy lifting.

The platform also shines when it comes to flexibility. Developers can write code in pretty much any language or framework they prefer, package it into containers, and deploy it seamlessly. Cloud Run supports everything from simple microservices to complex AI inference workloads, with the added benefit of easy integration with other Google Cloud services. If you need more power, it even offers on-demand access to GPUs for handling AI tasks. It’s a practical solution for businesses wanting to deploy apps quickly and cost-effectively without worrying about managing servers or containers.

Key Highlights:

  • Serverless platform that scales containers automatically
  • Supports any language, framework, or library in containers
  • Only pay for running code, no costs when idle
  • Integrates easily with other Google Cloud services
  • On-demand GPU access for AI workloads

Services:

  • Deployment and management of containerized applications
  • Scalable hosting for web apps, microservices, and APIs
  • AI workload management with GPU support
  • Event-driven and batch data processing
  • Integration with Cloud Functions and other Google Cloud services

Contact Information:

  • Website: cloud.google.com
  • Twitter: x.com/googlecloud

7. Virtuozzo

Virtuozzo is a company that focuses on making cloud and virtualization technology more accessible, especially for service providers. Their platform is designed to help hosting companies, managed service providers, and cloud providers deliver a range of services from cloud infrastructure to software-defined storage. The real kicker with Virtuozzo is their flexibility. They’ve developed a hybrid solution that helps businesses manage and scale their cloud services, all while making it easier to automate a lot of the processes. It’s like a full stack solution that covers everything from virtual machines to containers, all in one package.

One of the coolest things about Virtuozzo is their focus on simplifying complex cloud management for service providers. With their solutions, businesses can offer a variety of services, from PaaS to cloud hosting, without the usual complexity. They recently acquired Jelastic to strengthen their cloud platform, allowing them to offer a more complete and integrated solution. The result is a platform that gives businesses the freedom to choose their solutions and workloads, plus an easy-to-use orchestration tool for managing it all. It’s all about helping companies offer a better range of cloud-based services while keeping things simple.

Key Highlights:

  • Offers a full stack cloud platform for service providers
  • Focuses on simplifying and automating cloud management
  • Hybrid virtualization solutions with self-service capabilities
  • Recently acquired Jelastic for more robust cloud services
  • Supports a wide range of workloads, from PaaS to cloud infrastructure

Services:

  • Hybrid cloud and virtualization solutions
  • Kubernetes orchestration and management
  • Software-defined storage
  • DevOps Platform as a Service (PaaS)
  • Multi-cloud and cloud-native application management
  • Professional services and support for service providers

Contact Information:

  • Website: www.virtuozzo.com
  • Email: info@virtuozzo.com
  • Address: Vordergasse 59, Schaffhausen 8200, Switzerland
  • LinkedIn: www.linkedin.com/company/virtuozzo
  • Twitter: x.com/virtuozzoinc
  • Facebook: www.facebook.com/VirtuozzoInc

8. Portainer

Portainer is a platform designed to simplify the management of containerized applications, whether you’re working with Docker, Kubernetes, or Podman. What makes Portainer stand out is its ability to bring the power of containers to teams that might not have deep expertise in Kubernetes or Docker. It helps manage clusters at scale with an easy-to-use interface, so developers and IT teams can focus more on their applications and less on the complexities of container orchestration. Whether you’re running containers on the cloud, on-prem, or even at the edge, Portainer aims to make container management straightforward and accessible.

Portainer offers a range of features that cater to both enterprise IT teams and those working in industrial or IoT environments. It allows for fine-grained access control, supports automation, and integrates with popular container tools, making it ideal for organizations that want to manage their containers without reinventing the wheel. It’s also focused on scalability, enabling businesses to grow their container environments without the added complexity. With features like fleet management, centralized policy enforcement, and GitOps integration, Portainer simplifies the entire lifecycle of containerized apps, from deployment to monitoring.

Key Highlights:

  • Easy-to-use interface for managing containers at scale
  • Supports Docker, Kubernetes, and Podman environments
  • Provides access control and automation features
  • Can manage containers across cloud, on-prem, and edge environments
  • Integrates with existing container tools for centralized management

Services:

  • Container orchestration and management
  • GitOps integration for automated deployments
  • Access control and role-based access management
  • Fleet management for managing large container environments
  • Industrial and IoT container management solutions
  • Managed platform services for enterprise teams

Contact Information:

  • Website: www.portainer.io
  • LinkedIn: www.linkedin.com/company/portainer

9. KubeSphere

KubeSphere is all about making Kubernetes more manageable, especially for teams that want to scale without all the complexity. It’s a container platform built on Kubernetes, designed to handle everything from multi-cloud to multi-cluster environments with ease. KubeSphere aims to simplify the operations of Kubernetes, offering out-of-the-box features like application lifecycle management, storage, networking solutions, and cloud-native observability. What’s neat about it is that it lets developers deploy apps quickly using a user-friendly interface, while operations teams can benefit from built-in tools for monitoring, alerting, and CI/CD workflows. The platform also emphasizes flexibility, so users can easily plug in other tools and expand capabilities as needed.

One of the main selling points of KubeSphere is its ability to support multi-tenancy, which is perfect for businesses that need to securely manage containerized applications across teams. It’s built to grow with your needs, providing automated scaling, upgrades, and easy Kubernetes clusters, whether you’re running on the cloud or on-prem. Plus, KubeSphere’s pluggable architecture means it can integrate with just about any open-source tool, letting users tailor their platform as they see fit. This makes it a solid choice for businesses looking for a versatile, enterprise-grade solution without being locked into one vendor.

Key Highlights:

  • Simplifies Kubernetes management with a user-friendly interface
  • Supports multi-cloud and multi-cluster environments
  • Offers built-in tools for CI/CD, observability, and monitoring
  • Pluggable architecture for easy integration with other tools
  • Focuses on multi-tenancy and secure app deployment across teams

Services:

  • Kubernetes management and orchestration
  • Application lifecycle management and monitoring
  • Cloud-native observability and alerting
  • DevOps and GitOps automation
  • Multi-cloud and multi-cluster management
  • Integration with open-source tools and extensions

Contact Information:

  • Website: kubesphere.io
  • LinkedIn: www.linkedin.com/company/kubesphere
  • Twitter: x.com/KubeSphere
  • Facebook: www.facebook.com/kubesphere

10. DigitalOcean

DigitalOcean is a cloud platform that makes it easier for developers to deploy, manage, and scale applications. They focus on providing simple, affordable, and reliable infrastructure, especially for startups and small to medium-sized businesses. DigitalOcean’s offerings are designed to be user-friendly, even for teams that don’t have a lot of cloud experience. With tools like Droplets (virtual machines), Kubernetes, and managed databases, developers can quickly set up and manage their cloud environments without having to deal with the complexity of other larger providers. It’s all about keeping things simple and giving developers what they need to get their projects off the ground quickly.

What sets DigitalOcean apart is its approach to cost-effectiveness. Unlike some cloud providers that can overwhelm you with extra fees and complex billing, DigitalOcean keeps things straightforward and transparent. Their pricing is competitive, and they offer flexible billing options, so businesses don’t have to break the bank. Plus, DigitalOcean’s Kubernetes service is fully managed, making it easier for teams to scale their containerized applications without needing a dedicated ops team. Whether it’s for hosting websites, running applications, or powering machine learning models, DigitalOcean provides a reliable cloud solution with a focus on simplicity.

Key Highlights:

  • Simple, cost-effective cloud platform for developers
  • Managed Kubernetes service for easy container orchestration
  • Developer-friendly tools and user interface
  • Transparent and competitive pricing with no hidden fees
  • Scalable infrastructure for web apps, databases, and machine learning

Services:

  • Managed Kubernetes (DOKS)
  • Virtual machines (Droplets)
  • Managed databases (PostgreSQL, MySQL, etc.)
  • Cloud storage solutions (Spaces, Block Storage)
  • Networking solutions (Load Balancers, VPC)
  • AI and machine learning infrastructure with GPU-powered environments
  • Developer tools (API, CLI, monitoring)

Contact Information:

  • Website: www.digitalocean.com
  • LinkedIn: www.linkedin.com/company/digitalocean
  • Twitter: x.com/digitalocean
  • Instagram: www.instagram.com/thedigitalocean
  • Facebook: www.facebook.com/DigitalOceanCloudHosting

11. Cloud Foundry

Cloud Foundry is an open-source platform designed to make deploying cloud-native applications a whole lot easier. It’s not about getting bogged down with complex infrastructure setups or having to manually configure every little thing. Instead, it focuses on letting developers push their code and get it running on the cloud with a simple cf push command. Whether you’re using Java, Node, Python, or any other popular language, Cloud Foundry helps you deploy your applications quickly and efficiently. The best part is that you don’t need to worry about managing Kubernetes or Istio; you can just focus on what you’re building.

The platform is highly extensible, thanks to a community-driven ecosystem of buildpacks and services. This makes it a great option for teams who want to stick with their preferred developer tools and frameworks without sacrificing the flexibility of the cloud. It also supports multi-cloud environments, so businesses can deploy and manage apps across different infrastructures. With tools like Korifi, which offers a higher-level abstraction over Kubernetes, Cloud Foundry allows developers to stay productive while ensuring their apps are running smoothly and securely.

Key Highlights:

  • Simplifies cloud-native app deployment with cf push
  • Supports a wide range of programming languages and frameworks
  • No need for complex Kubernetes management
  • Community-driven with extensive buildpack and service integrations
  • Multi-cloud deployment capabilities

Services:

  • Cloud-native application deployment and management
  • Integration with Kubernetes through Korifi for a higher-level abstraction
  • Multi-cloud support for deployment across various platforms
  • Developer tools for app lifecycle management
  • Extensive tutorials and community resources for learning

Contact Information:

  • Website: www.cloudfoundry.org
  • LinkedIn: www.linkedin.com/company/cloud-foundry
  • Twitter: x.com/cloudfoundry

12. Cast AI

Cast AI focuses on taking some of the day-to-day grind out of running Kubernetes. Instead of teams constantly adjusting resources or trying to predict what their clusters will need next week, they use automation to keep everything running efficiently behind the scenes. Their platform watches how workloads behave and shifts things around so applications get the resources they need without piling up unused capacity. It’s basically their way of saying that Kubernetes doesn’t have to feel chaotic if the right guardrails are in place.

Most companies come to Cast AI because juggling performance, cost, and stability on Kubernetes gets tiring fast. Cast AI leans into that reality by handling a lot of the tuning and scaling decisions that normally take hours of DevOps time. They also give teams clearer insight into what’s happening inside their clusters, so people can make adjustments without digging through endless dashboards. The whole setup lets engineering teams focus more on building things and less on babysitting clusters.

Key Highlights:

  • Automates resource allocation and workload tuning inside Kubernetes
  • Keeps clusters stable with automatic scaling and adjustment
  • Helps reduce cloud overspending through smarter resource planning
  • Provides tooling to track how workloads behave over time
  • Designed to simplify Kubernetes operations for smaller and larger teams alike

Services:

  • Automated optimization for Kubernetes clusters
  • Workload rightsizing and scheduling
  • Cost monitoring and usage insights
  • Kubernetes security and compliance tooling
  • Autoscaling for CPU, GPU, and other compute-heavy tasks
  • Integrations with common observability and DevOps tools

Contact Information:

  • Website: cast.ai
  • Email: hello@cast.ai
  • Address: 111 NE 1st St, Miami, FL 33132, United States
  • LinkedIn: www.linkedin.com/company/cast-ai
  • Twitter: x.com/cast_ai
  • Facebook: www.facebook.com/cast.ai.platform

13. Traefik

Traefik is an open-source tool that focuses on simplifying application routing and load balancing, especially in containerized environments like Docker Swarm. It serves as an external reverse proxy that helps direct traffic to the right places, keeping applications running smoothly. By automatically discovering services in a Docker Swarm cluster, it makes managing complex container setups much more manageable. What’s great about Traefik is its ability to update routes dynamically as containers scale up or down. This makes it perfect for environments where services are constantly changing, like microservices applications.

What really sets Traefik apart is its ease of use and automation. It integrates with Kubernetes as well as Docker, so it works across different container orchestration systems. With built-in support for things like TLS termination and automatic Let’s Encrypt certificate management, it ensures that connections are secure without much effort from the team. It’s also highly flexible, so as infrastructure needs change, migrating from Docker Swarm to something like Kubernetes doesn’t require major reconfigurations of your routing setup. Traefik simply adapts, making it a long-term solution for networking needs in containerized environments.

Key Highlights:

  • Simplifies application routing and load balancing for Docker Swarm and Kubernetes
  • Supports automatic service discovery and configuration updates
  • Provides TLS termination and automatic certificate management with Let’s Encrypt
  • Flexible and can easily adapt to different container orchestration systems
  • Great for microservices with dynamic service scaling

Services:

  • Reverse proxy and load balancing for containerized environments
  • Kubernetes and Docker Swarm ingress management
  • API gateway and API management
  • Web application firewall and security features
  • Integration with various cloud providers and technologies
  • Community-driven, open-source platform with extensive documentation

Contact Information:

  • Website: traefik.io
  • LinkedIn: www.linkedin.com/company/traefik
  • Twitter: x.com/traefik

14. Northflank

Northflank is a platform built around the idea of making it easier for teams to run containers, databases, and all sorts of workloads without wrestling with infrastructure every day. They use Kubernetes under the hood, but they keep most of the complexity out of sight so teams can focus on actually shipping things. Whether a team wants to run AI models, traditional web apps, or quick test environments, they offer a setup that can live on their cloud or inside a company’s own cloud account. It’s flexible in a way that doesn’t feel heavy, which is why people tend to stick with it when they want to avoid dealing with raw Kubernetes.

They also put a lot of effort into the developer experience. Things like spinning up preview environments, linking Git builds, scaling services, and checking logs all sit in one place. And for teams doing more advanced work, like GPU workloads or multi-cloud setups, Northflank doesn’t block them in. It adapts instead of forcing a specific workflow. So even though the platform is packed with features, day-to-day use feels more like a toolkit that quietly handles the annoying parts of running modern apps.

Key Highlights:

  • Streamlines running containers, databases, and AI workloads
  • Keeps Kubernetes complexity hidden behind a cleaner interface
  • Works across multiple clouds or inside a company’s own infrastructure
  • Supports fast development workflows like preview environments and Git-based builds
  • Designed to scale from small projects to large, multi-service platforms

Services:

  • Managed environments for running containers and databases
  • Automated CI/CD pipelines and release workflows
  • GPU-powered workloads for AI models and training
  • Multi-cloud and bring-your-own-cloud deployment options
  • Observability tools for logs, metrics, and environment health
  • Templates and IaC tools for repeatable infrastructure setups

Contact Information:

  • Website: northflank.com
  • Email: contact@northflank.com
  • Address: 20-22 Wenlock Road, London, England, N1 7GU
  • LinkedIn: www.linkedin.com/company/northflank
  • Twitter: x.com/northflank

Conclusion

Docker Swarm had its moment, but the ecosystem around container orchestration has grown way past what it can comfortably handle. The good news is that there’s no shortage of tools that pick up where Swarm falls short, each with its own personality and way of solving the same set of headaches. Some lean into automation, others focus on developer experience, and a few try to simplify Kubernetes enough that it stops feeling like a second job.

The real takeaway is that you don’t have to force Swarm to do things it was never built for. Whether you want something lightweight, something hands-off, or something that can scale without drama, there’s an option that fits. The easiest way to figure out what works for your team is to test one or two in a low-risk setup. You’ll know pretty quickly which approach feels natural and which one adds more friction than it solves. In the end, the right choice is the one that lets you spend less time wrestling with infrastructure and more time actually building things.


Top K6 Alternatives for Load Testing

Load testing doesn’t have to feel like you’re married to one tool forever. Sometimes the team just needs a different flavor – maybe something that runs anywhere, or lives entirely in code, or leans hard into real browsers. Below we’ve pulled together 11  options that keep popping up when people start looking around for something other than k6. Nothing here is crowned king; they’re just different ways of getting the same job done, each with its own quirks and habits that click better for certain projects or certain brains.

You’ll spot the usual open-source suspects, a couple of cloud platforms that take the heavy lifting off your shoulders, and a few that try to solve the problem from a completely different angle. Think of it like a menu – skim through, see what sounds like it would fit your current mess, and give it a spin. No sales pitch, just the straight rundown.

1. AppFirst

AppFirst comes from a small team that’s trying to solve a problem a lot of engineering groups run into once they get past the “one big monolith” stage: every new service suddenly needs its own VPC, IAM roles, observability setup, and a pile of Terraform that nobody wants to write or review. Instead of making yet another load-testing tool, they went the opposite direction; they built something that quietly spins up the actual production-like environment so you can point real load generators (k6, JMeter, Locust, whatever) at it without begging the infra team for a sandbox first.

In practice that means developers can declare “I need Postgres, Redis, and a public endpoint” and get a ready-to-hit cluster in minutes instead of days. For performance testing it turns out to be handy because the environment is close enough to real production that the numbers you get from k6 actually mean something, and you don’t waste half the sprint fighting cloud permissions just to run a quick ramp-up test.

Key Highlights:

  • Takes a short app manifest and builds full cloud landing zones automatically.
  • Supports AWS, Azure, and GCP with the same declaration file.
  • Wires up logging, metrics, and alerts without extra config.
  • Gives each service its own isolated network and cost tagging.
  • Can be run as SaaS or self-hosted inside your own accounts.
  • Lets any load-testing tool hit production-like targets instantly.

Contact and Social Media Information:

2. Apache JMeter

Apache JMeter serves as an open-source tool built in Java for checking how applications handle loads and perform tasks. It started out focused on web apps but grew to cover a wider range of testing scenarios, working with both static files and dynamic setups. Teams use it to mimic traffic on servers or networks, pulling apart how things hold up when things get busy. The setup lets you record plans quickly, debug on the fly, and run everything from a command line across various operating systems.

What stands out is its flexibility at the protocol level, meaning it interacts directly without mimicking full browser actions like running scripts in pages. This keeps things straightforward for core checks, though it skips the visual side of rendering. Extensions come easy through plugins and scripting options, allowing tweaks for specific needs without starting from scratch every time.

Key Highlights:

  • Supports testing across protocols like HTTP, HTTPS, SOAP, FTP, JDBC, LDAP, JMS, SMTP, TCP, and more.
  • Includes a test IDE for recording, building, and debugging plans.
  • Runs in CLI mode for headless operation on Linux, Windows, or Mac.
  • Generates dynamic HTML reports for results.
  • Handles correlation by extracting data from formats like HTML, JSON, or XML.
  • Offers full multi-threading for concurrent sampling.
  • Provides caching and offline analysis of test outcomes.
  • Extensible with pluggable samplers, scriptable options in Groovy or BeanShell, and data visualization plugins.

Contact and Social Media Information:

  • Website: jmeter.apache.org
  • Twitter: x.com/ApacheJMeter

3. Gatling

Gatling operates as a load testing platform that handles simulations for various application types, from web setups to APIs and cloud environments. It accommodates different creation methods, whether through code in languages like Java or JavaScript, or simpler no-code approaches, and pulls in elements from tools like Postman. The platform ties into development flows by linking with CI/CD pipelines, allowing automated runs and management of resources in a shared space.

Collaboration features let groups handle scripts, executions, and reports together, while infrastructure options support scaling across locations or private setups. Analysis tools track metrics and trends, feeding into broader observability systems. It’s geared toward ongoing integration, with options for dashboards that compare results over time and adjust based on feedback loops.

Key Highlights:

  • Works with web applications, APIs, microservices, cloud setups, and AI models.
  • Allows test creation via code, no-code, or imports from Postman.
  • Integrates into CI/CD for automated performance checks.
  • Supports team collaboration on scripts, runs, and reports.
  • Manages global or private infrastructure for virtual user generation.
  • Provides customizable dashboards for metrics and trends.
  • Includes CLI and API triggers for orchestration.
  • Handles data from observability stacks for deeper insights.

Contact and Social Media Information:

  • Website: gatling.io
  • Twitter: x.com/GatlingTool
  • LinkedIn: www.linkedin.com/company/gatling

4. Locust

Locust functions as an open-source load testing tool where behaviors get defined straight in Python code, skipping interfaces or complex files for a more direct approach. It scales by distributing tests across machines, handling large user simulations without much overhead. The code-based setup makes it simple to outline tasks like logins or page loads, with waits built in to match real patterns.

Running tests happens through a basic command, and it supports parsing elements like HTML in scenarios. While it’s strong on HTTP, extensions cover other areas, and the distributed nature helps with bigger loads. Community input keeps it evolving, with options for hosted versions that add reporting layers.

Key Highlights:

  • Defines user behaviors and tasks using Python code.
  • Supports distributed testing over multiple machines for scalability.
  • Includes wait times between tasks to simulate realistic patterns.
  • Handles HTTP requests with options for login simulations and asset loads.
  • Allows HTML parsing and nested task structures.
  • Runs via command line for straightforward execution.
  • Integrates with cloud-hosted options for detailed reporting.
  • Draws from a wide contributor base for ongoing tweaks.

Contact and Social Media Information:

  • Website: locust.io
  • Twitter: x.com/locustio

5. BlazeMeter

BlazeMeter runs as a cloud platform that teams use for different kinds of testing, from performance checks to functional runs and API work. It builds on top of open tools like JMeter but adds a managed layer so people can run bigger tests without handling the infrastructure themselves. The setup also covers service virtualization and test data creation, which helps when real dependencies are hard to reach during early stages.

A lot of the workflow happens through a shared interface where scripts get uploaded, tests get scheduled, and results show up in one spot. It ties into CI/CD pipelines the way many teams already work, and the platform handles scaling the load across cloud regions when needed.

Key Highlights:

  • Supports JMeter scripts directly in a cloud environment.
  • Includes performance, functional, API testing, and monitoring options.
  • Offers service virtualization for simulating missing services.
  • Provides AI-driven test data generation.
  • Works with Jenkins and other common CI/CD tools.
  • Runs tests from multiple geographic locations.

Contact and Social Media Information:

  • Website: www.blazemeter.com
  • E-mail: info@perforce.com
  • Twitter: x.com/perforce
  • LinkedIn: www.linkedin.com/company/perforce
  • Address: 400 First Avenue North #400 Minneapolis, MN 55401
  • Phone: +1 612.517.2100

6. LoadView

LoadView offers a cloud-based way to run load tests inside actual browsers instead of just hitting protocols. Teams point and click to record user flows or upload scripts, then the platform spins up connections from various spots around the world using AWS and Azure under the hood. It handles websites, web apps with multiple steps, and straight API calls without needing to manage any servers on your end.

The whole thing stays managed, so once the scenario is set, the heavy lifting of generating traffic happens elsewhere. Different load curves let you ramp up slowly, hit a target and hold, or adjust on the fly while watching how the application reacts in real time.

Key Highlights:

  • Executes tests in real browsers like Chrome, Firefox, and mobile ones.
  • Records scripts with point-and-click instead of coding everything.
  • Supports HTTP/S, REST, SOAP, and multi-step web app flows.
  • Offers load step, goal-based, and dynamic adjustable curves.
  • Generates load from over 40 locations using managed cloud.
  • Includes Postman collection import for API scenarios.

Contact and Social Media Information:

  • Website: www.loadview-testing.com
  • E-mail: sales@loadview-testing.com
  • Facebook: www.facebook.com/dotcommonitor
  • Twitter: x.com/loadviewtesting
  • LinkedIn: www.linkedin.com/company/dotcom-monitor
  • Address: 2500 Shadywood Road, Suite #820 Excelsior, MN 55331
  • Phone: 1-888-479-0741

7. Artillery

Artillery started as a straightforward Node.js tool for scripting load tests in code, but it has grown into a full platform that now mixes HTTP checks with Playwright-based browser testing and upcoming monitoring features. Engineers write scenarios in YAML or JavaScript, reuse existing Playwright tests for load, and run everything either locally, in their own cloud accounts, or through a managed service.

The newer parts focus on making big Playwright suites run faster by splitting them automatically and collecting proper web vitals alongside the usual metrics. It fits teams who already lean on code for testing and want the same approach when checking how things hold up under real traffic.

Key Highlights:

  • Supports HTTP, WebSocket, GraphQL, and Playwright browser scenarios.
  • Reuses Playwright E2E tests directly for load generation.
  • Runs distributed tests from personal AWS/Azure or managed cloud.
  • Includes built-in OpenTelemetry tracing and GitHub integration.
  • Provides dashboards, AI summaries for failures, and cost tracking.
  • Handles large-scale sharding for Playwright suites.

Contact and Social Media Information:

  • Website: www.artillery.io
  • E-mail: support@artillery.io
  • Twitter: x.com/artilleryio

8. WebLOAD

WebLOAD comes from RadView as a load testing tool that people have used since the early nineties for checking how applications hold up under traffic. It works on-premises, in the cloud, or a mix of both, and the scripting side leans on a correlation engine that grabs dynamic values like session IDs on its own. Teams can still drop in JavaScript when they need extra logic, and it handles regular web protocols plus things like WebSockets without much fuss.

The analytics part shows data while tests run, with a dashboard that sits in a browser and some AI touches for spotting patterns quicker. Overall it follows the usual flow – record or build scripts, throw load from wherever, then dig through reports to figure out what broke or slowed down.

Key Highlights:

  • Automatic correlation for dynamic values in scripts.
  • Supports JavaScript extensions inside test scenarios.
  • Runs from cloud, on-prem, or hybrid setups.
  • Collects server-side metrics during execution.
  • Browser-based dashboard with real-time views.
  • Includes AI-powered insights in the analysis section.

Contact and Social Media Information:

  • Website: www.radview.com/webload
  • E-mail: sales@radview.com
  • Facebook: www.facebook.com/RadviewSoftware
  • Twitter: x.com/RadViewSoftware
  • LinkedIn: www.linkedin.com/company/radview-software
  • Address: 991 Highway 22 West, Suite 200 Bridgewater, NJ 08807
  • Phone: +19085267756

9. ReadyAPI 

ReadyAPI bundles several testing pieces under the SmartBear umbrella, pulling together functional API checks, contract testing, and load work into one on-premise platform. The load side used to live under LoadNinja and focuses on running performance scripts through real browsers instead of just protocol calls. Teams either record user flows or write them out, then fire them off against the application to see how the front-end behaves when a crowd shows up.

It fits alongside the rest of SmartBear’s tools like TestComplete or Swagger stuff, so if a group already uses those, spinning up load tests stays in the same ecosystem. Nothing too wild – just a solid way to mix API-level and UI-level load work without jumping between completely separate products.

Key Highlights:

  • Combines functional, contract, and load testing in one platform.
  • Runs load tests using actual browsers for UI scenarios.
  • Ties into other SmartBear tools like Swagger and TestComplete.
  • Supports recording or scripting of user flows.
  • Handles API protocols alongside browser-based traffic.

Contact and Social Media Information:

  • Website: smartbear.com/product/ready-api
  • E-mail: info@smartbear.com
  • Facebook: www.facebook.com/smartbear
  • Twitter: x.com/smartbear
  • LinkedIn: www.linkedin.com/company/smartbear
  • Instagram: www.instagram.com/smartbear_software
  • Address: SmartBear Software 450 Artisan Way Somerville, MA 02145
  • Phone: +1 617-684-2600

10. PFLB

PFLB runs a cloud platform that teams use when they want to throw load at web apps or APIs without building their own generator fleet. It leans hard on JMeter under the hood, so people can drop in existing scripts or pull stuff straight from Postman collections and get it running across a bunch of regions. The interface stays pretty straightforward – pick a profile, set the numbers, and let it go.

What sets it apart a bit is the AI layer that chews through results afterward and spits out plain-English summaries instead of just graphs. It also hooks into CI/CD pipelines through an API if you want the tests to fire off automatically on every push.

Key Highlights:

  • Executes JMeter scripts in a managed cloud environment.
  • Imports Postman and Insomnia collections for quick setup.
  • Generates load from multiple global locations.
  • Includes AI-driven summaries of test results.
  • Offers trending and comparison views across runs.
  • Supports gRPC and Kafka testing alongside regular HTTP.
  • Provides REST API for pipeline integration.

Contact and Social Media Information:

  • Website: pflb.us
  • E-mail: sales@pflb.us
  • Twitter: x.com/pflb22
  • LinkedIn: www.linkedin.com/company/pflb
  • Address: 2810 N Church St, PMB 729811, Wilmington, Delaware 19802-4447, US
  • Phone: +14084182552

11. OpenText LoadRunner 

LoadRunner has been around forever in the enterprise testing space and now lives under the OpenText umbrella in a few flavors – cloud version, on-prem enterprise, and the classic professional edition. Most teams pick it when they need something that handles huge distributed tests with thousands of virtual users and still gives detailed protocol-level control. It covers everything from plain HTTP to heavy enterprise protocols that hardly anything else touches.

The scripting side still feels very point-and-click with a thick desktop client, though you can drop in custom code when the built-in blocks aren’t enough. Reports come out detailed and the whole thing integrates with the rest of the OpenText DevOps lineup if you’re already stuck in that ecosystem.

Key Highlights:

  • Supports deep protocol coverage beyond basic web traffic.
  • Offers cloud-based, on-prem, and hybrid deployment options.
  • Includes TruClient for real-browser testing scenarios.
  • Handles large-scale distributed testing across locations.
  • Provides detailed correlation and parameterization tools.
  • Ties into service virtualization for missing components.
  • Works with CI/CD systems through plugins.

Contact and Social Media Information:

  • Website: www.opentext.com
  • E-mail: partners@opentext.com
  • Twitter: x.com/OpenText
  • LinkedIn: www.linkedin.com/company/opentext
  • Phone: +800-4996-5440

Wrapping things up

Wrapping things up, there’s no single tool out there that just slides in and does everything k6 does exactly the same way, only better. What you end up with is a bunch of different flavors, each giving up something to gain something else. Some lean hard into pure code and zero UI, others keep the old-school drag-and-drop recorder because half the team still swears by it, a few go all-in on real browsers at scale, and then you’ve got the ones that try to solve the “I can’t even get a realistic environment to point my tests at” problem first.

Pick whichever trade-off annoys you the least. Run the same basic script in two or three of them one afternoon when nobody’s looking, stare at the reports, and ask the room “does this feel painful or does it feel fine?” The one that gets the fewest groans usually wins. That’s pretty much the whole decision process once you strip away the marketing slides. Good luck, and may your response times stay low and your on-call nights stay quiet.


Best Netdata Alternatives People Actually Use in 2026

Netdata is great when you want something lightweight that just works out of the box, but eventually a lot of teams hit limits – scaling, deeper integrations, better alerting, or simply prettier graphs. Below are 14 tools that regularly show up when folks look for the next step. Some are massive all-in-one platforms, some are hyper-focused, and a few are pure visualization layers. Pick whichever matches the gap you’re feeling.

1. AppFirst

AppFirst is a newer platform that tries to let developers deploy applications without having to write any Terraform or cloud-specific code themselves. You basically tell it what your app needs – CPU, database, networking, container image – and it spins up the underlying infrastructure across AWS, Azure, or GCP with all the security defaults already applied.

It’s aimed at teams that want developers to own the full lifecycle of their service but don’t want them spending days learning VPC layouts or writing IAM policies. The idea is that the platform handles the repeatable infra bits so engineers can stay focused on the actual product code.

Key Highlights:

  • Provisions full application environments from simple declarations
  • Works across major cloud providers
  • Applies security and compliance settings automatically
  • Provides built-in logging, monitoring, and cost tracking
  • SaaS or self-hosted deployment options

Contact and Social Media Information:

zabbix

2. Zabbix

Zabbix serves as an open-source observability solution designed for monitoring IT and OT environments, including cloud infrastructure, networks, services, and IoT devices. It provides a unified view of systems through a single pane of glass, enabling integration with existing infrastructure components. Deployable on-premise or in the cloud, it supports monitoring across data centers, edge devices, and hybrid setups.

The solution focuses on collecting and processing data for visibility into performance and availability, with capabilities for automated discovery and real-time tracking. It emphasizes scalability and stability to maintain operational efficiency in diverse environments.

Key Highlights:

  • Open-source with no licensing fees or per-device charges.
  • Supports on-premise deployment for full control and data privacy.
  • Offers integrations with existing systems for comprehensive monitoring.
  • Provides 24/7 support through a global partner network.
  • Enables multitenant operations suitable for managed service providers.

Contact and Social Media Information:

  • Website: www.zabbix.com
  • E-mail: sales@zabbix.com
  • Facebook: www.facebook.com/zabbix
  • Twitter: x.com/zabbix
  • LinkedIn: www.linkedin.com/company/zabbix
  • Address: 211 E 43rd Street, Suite 7-100, New York, NY 10017, USA
  • Phone: +18774922249

prometheus

3. Prometheus

Prometheus is an open-source monitoring system and time series database that utilizes a dimensional data model to identify time series through metric names and key-value pairs. It features the PromQL query language, which enables querying, correlating, and transforming time series data for purposes such as visualizations and alerts. Alerting rules, defined using PromQL and leveraging the dimensional model, are managed by a separate Alertmanager component for notifications and silencing. The system operates with independent servers that rely on local storage, and its binaries, developed in Go, facilitate deployment across environments.

This setup allows for handling metrics from applications and services in a way that’s geared toward cloud-native setups, though it keeps things modular enough for other contexts. It’s all about pulling in data reliably and making it queryable without too much overhead.

Key Highlights:

  • Flexible dimensional data model for time series identification via metric names and key-value pairs.
  • PromQL query language for querying, correlating, and transforming time series data.
  • Alerting rules based on PromQL, with Alertmanager handling notifications and silencing.
  • Independent servers using local storage, with statically linked Go binaries for deployment.
  • Instrumentation libraries and integrations for extracting metrics from systems.

Contact and Social Media Information:

  • Website: prometheus.io
  • E-mail: prometheus.io
  • App Store: apps.apple.com/ru/app/prometheus-metrics-reader/id6448750573

4. Grafana IRM

Grafana is an open and composable observability platform that enables users to query, visualize, and alert on data from various sources. It supports monitoring of applications, infrastructure, and other systems through dashboards and pre-built solutions. Grafana integrates with telemetry data such as metrics, logs, traces, and profiles, allowing for the creation of visualizations and alerts based on data from multiple backends.

What stands out is how it acts as a front-end layer, connecting dots between different tools rather than trying to do everything itself. You end up with customizable views that make sense of mixed data sources, which can feel less chaotic when you’re juggling multiple systems.

Key Highlights:

  • Grafana provides visualization capabilities for data from various sources, including support for logs, metrics, traces, and profiles.
  • It offers monitoring solutions for applications, infrastructure, and specific technologies like Kubernetes and databases.
  • Grafana includes alerting features that trigger notifications from any connected data source.
  • The platform supports plugins to connect with additional data sources, applications, and tools.
  • Grafana facilitates incident response management with workflows for on-call management and incident handling.

Contact and Social Media Information:

  • Website: grafana.com
  • E-mail: info@grafana.com
  • Facebook: www.facebook.com/grafana
  • Twitter: x.com/grafana
  • LinkedIn: www.linkedin.com/company/grafana-labs
  • App Store: apps.apple.com/ru/app/grafana-irm
  • Google Play: play.google.com/store/Grafana

5. Checkmk

Checkmk started out as a fork of Nagios years back but has grown into its own thing with a much faster core and way less manual hassle. People use it when they want to watch everything from physical servers to cloud instances and containers without writing a ton of custom scripts. The system automatically finds new devices, figures out what services are running, and applies the right checks, so you’re not stuck clicking through menus all day to add a single host.

A lot of teams like that it has a proper open-source edition you can run forever without paying, but also paid versions that add things like distributed monitoring sites or tighter cloud integrations. If you enjoy tweaking plug-ins or writing your own, the platform doesn’t fight you – everything is scriptable and the API is decent.

Key Highlights:

  • Automatic host discovery and service configuration
  • Raw edition is completely open-source and free
  • Paid editions for distributed setups and cloud workloads
  • REST API for automation and custom integrations

Contact and Social Media Information:

  • Website: checkmk.com
  • E-mail: sales@checkmk.com
  • Facebook: www.facebook.com/checkmk
  • Twitter: x.com/checkmk
  • LinkedIn: www.linkedin.com/company/checkmk
  • Google Play: play.google.com/store/Checkmk
  • Address: Checkmk GmbH Kellerstraße 27 81667 Munich Germany
  • Phone: +44 20 3966 1150

6. Datadog

Datadog is one of those tools that shows up everywhere once companies start living in the cloud. You drop a small agent on your boxes (or skip it entirely for serverless), and suddenly you’ve got metrics, traces, and logs flowing into one place. The dashboards are clean, and the tagging system makes it easy to slice data however you want – by team, environment, customer, whatever.

It leans hard into modern stacks: Kubernetes, Docker, AWS Lambda, all the usual suspects. If you’re already paying for a cloud bill the size of a car payment, Datadog feels pretty natural because it speaks the same language as the rest of your infrastructure.

Key Highlights:

  • Single agent collects metrics, traces, and logs
  • Strong Kubernetes and serverless coverage out of the box
  • Tagging and filtering system for organizing big environments
  • Real-time security monitoring alongside performance data
  • Hundreds of turnkey integrations with cloud services

Contact and Social Media Information:

  • Website: www.datadoghq.com
  • E-mail: info@datadoghq.com
  • Twitter: x.com/datadoghq
  • LinkedIn: www.linkedin.com/company/datadog
  • Instagram: www.instagram.com/datadoghq
  • App Store: apps.apple.com/us/app/datadog
  • Google Play: play.google.com/store/apps/datadog.app
  • Address: 620 8th Ave 45th Floor New York, NY 10018 USA
  • Phone: 866 329-4466

7. New Relic

New Relic has been around long enough that half the internet probably still has their Java agent installed somewhere. These days it’s trying to be the one dashboard that covers hosts, containers, applications, and even the browser side of things. You get metrics, distributed tracing, error tracking, and logs without juggling five different tools.

Teams that already have a mix of old-school servers and newer cloud-native apps seem to land here a lot. The pricing is usage-based, so you only pay for what actually sends data, which keeps the finance people from having a heart attack when traffic spikes.

Key Highlights:

  • Full-stack view from infrastructure to browser
  • Distributed tracing across services
  • Usage-based pricing with a generous free tier
  • Built-in anomaly detection and alerting
  • Mobile and browser performance monitoring included

Contact and Social Media Information:

  • Website: newrelic.com
  • Facebook: www.facebook.com/NewRelic
  • Twitter: x.com/newrelic
  • LinkedIn: www.linkedin.com/company/new-relic-inc-
  • Instagram: www.instagram.com/newrelic
  • App Store: apps.apple.com/ru/app/new-relic
  • Google Play: play.google.com/store/newrelic
  • Address: 1100 Peachtree Street NE, Suite 2000, Atlanta, GA 30309, USA
  • Phone: (585) 632-6563

8. Dynatrace

Dynatrace runs as a single-agent platform that watches everything from infrastructure and applications to user sessions and security signals. It pulls in metrics, traces, logs, and events, then tries to connect the dots automatically so people spend less time figuring out why something broke. The system leans on its own AI engine to spot patterns and suggest what might be wrong before alerts flood in.

A lot of bigger teams pick it when they want one tool that covers the whole stack without stitching together separate products. You install the agent, point it at your clusters or hosts, and it starts mapping dependencies on its own.

Key Highlights:

  • Single agent for full-stack data collection
  • Automatic dependency mapping across services
  • Built-in AI for anomaly detection and root cause suggestions
  • Covers applications, infrastructure, logs, and user experience
  • Supports cloud-native and traditional environments

Contact and Social Media Information:

  • Website: www.dynatrace.com
  • E-mail: sales@dynatrace.com
  • Facebook: www.facebook.com/Dynatrace
  • Twitter: x.com/Dynatrace
  • LinkedIn: www.linkedin.com/company/dynatrace
  • Instagram: www.instagram.com/dynatrace
  • App Store: apps.apple.com/ru/app/dynatrace-4-0
  • Google Play: play.google.com/store/Dynatrace
  • Address: 280 Congress Street, 11th Floor Boston, MA 02210 United States of America
  • Phone: 18888333652

9. Icinga

Icinga came out of the old Nagios world but cleaned up a lot of the rough edges and added its own web interface and configuration tools. People still use it for classic server and network checks, but it also handles Kubernetes and cloud stuff without too much extra work. The setup stays pretty flexible – you can keep everything in text files or use the Director module if you prefer a GUI.

It’s one of those tools that never really went away because a ton of sysadmins already know how it works, and the community keeps the plug-ins coming. If you’re comfortable with check scripts and a bit of command-line work, it just keeps running.

Key Highlights:

  • Classic host and service checking with plug-ins
  • Web interface and configuration database option
  • Supports distributed setups with multiple zones
  • Handles servers, networks, and containers
  • Fully open-source core

Contact and Social Media Information:

  • Website: icinga.com
  • E-mail: info@icinga.com
  • Facebook: www.facebook.com/icinga
  • LinkedIn: www.linkedin.com/company/icinga
  • Address: Icinga GmbH Deutschherrnstr. 15-19 90429 Nuremberg, Germany
  • Phone: +49 911 9288555

10. OpenNMS

OpenNMS has been around forever as a pure network-focused monitoring system that grew into something bigger. It started with polling devices via SNMP but now does flow analysis, event correlation, and even some application-layer checks. The whole thing stays completely open-source, and the company behind it makes money on support subscriptions for the stable Meridian releases.

Teams that manage large or distributed networks seem to end up here a lot because it scales out horizontally and doesn’t choke on thousands of interfaces. You drop it in, let it discover your network, and it starts graphing whatever it finds.

Key Highlights:

  • Strong SNMP polling and flow collection
  • Event-driven architecture with correlation rules
  • Distributed minion setup for large environments
  • Built-in traffic analysis tools
  • 100 % open-source with optional paid support

Contact and Social Media Information:

  • Website: www.opennms.com
  • E-mail: contactus@opennms.com
  • Facebook: www.facebook.com/OpenNMS
  • Twitter: x.com/opennms
  • LinkedIn: www.linkedin.com/company/the-opennms-group
  • Address: 2871 Lake Vista Drive Lewisville, TX 75067
  • Phone: +1 919-533-0160

11. SigNoz

SigNoz shows up as a newer open-source tool that tries to keep logs, metrics, and traces in one place instead of running separate systems. Teams that already use OpenTelemetry tend to give it a look because it speaks that language natively and stores everything in ClickHouse, which handles big volumes without complaining too much. You can run it yourself on a few servers or let them host it if you don’t want the ops overhead.

Most people who switch to it seem to come from the paid big-name platforms and just want something they can actually control and extend without getting surprise invoices. It’s still growing, but the basics are there – dashboards, alerts, exception tracking, the usual stuff you expect once you’re past toy projects.

Key Highlights:

  • Built around OpenTelemetry for logs, traces, and metrics
  • Uses ClickHouse as the backend storage
  • Self-host or managed cloud options
  • Single UI for all signals with correlation between them
  • No pricing tied to users or hosts

Contact and Social Media Information:

  • Website: signoz.io
  • Twitter: x.com/SigNozHQ
  • LinkedIn: www.linkedin.com/company/signozio

12. Cacti

Cacti has been the go-to graphing tool for anyone who lives in SNMP land since forever. You point it at switches, routers, servers, whatever speaks SNMP, and it starts drawing pretty round-robin graphs using RRDTool underneath. The interface looks like it hasn’t changed much in fifteen years, and that’s actually fine for a lot of network folks who just want reliable long-term graphs without drama.

People still run it because it does one thing really well and doesn’t try to be everything to everyone. If your job is keeping an eye on interface counters and bandwidth trends across a campus or data center, Cacti still gets dropped into new setups more often than you’d think.

Key Highlights:

  • Classic SNMP polling and RRDTool graphing
  • Template system for devices and graphs
  • Plugin architecture to add extra features
  • Role-based user management
  • Works on everything from small LANs to large networks

Contact and Social Media Information:

  • Website: www.cacti.net

13. LibreNMS

LibreNMS grew out of the old Observium fork and turned into its own thing with a cleaner look and more community-driven development. It auto-discovers your network using the usual protocols, builds maps, tracks ports, and throws alerts when something goes down or gets weird. The web UI feels modern enough that you don’t cringe when you open it on a phone.

A decent chunk of ISPs and companies with big layer-2/3 setups still swear by it because it just works and doesn’t cost anything unless you want official support. You install it, let it scan, and suddenly you can see which customer is hammering the link at 3 a.m.

Key Highlights:

  • Automatic discovery via SNMP, CDP, LLDP, OSPF, BGP
  • Bandwidth billing based on port usage
  • Distributed polling for larger networks
  • Integrations with Oxidized, RANCID, and other tools
  • Full REST API for scripting

Contact and Social Media Information:

  • Website: www.librenms.org
  • Facebook: www.facebook.com/LibreNMS
  • Twitter: x.com/LibreNMS

14. Pandora FMS

Pandora FMS handles a pretty wide range of monitoring tasks from one console – networks, servers, applications, logs, even some user-experience checks and remote control features. Teams that want to keep an eye on both old-school hardware and newer cloud stuff without switching between five different tools sometimes land on it. The agent works on pretty much every operating system you can think of, and they also have an enterprise version if you need official support or extra modules.

It’s one of those platforms that started years ago and just kept adding pieces over time, so you end up with things like inventory, ticketing, and satellite servers for remote sites all in the same package. Some places run the open-source community edition, others pay for the full thing with the fancy reporting and 24/7 help.

Key Highlights:

  • Covers networks, servers, applications, and log collection
  • Agent supports Windows, Linux, Unix, mainframes, and more
  • Includes remote control and inventory features
  • Satellite servers for monitoring remote locations
  • Open-source community version and paid enterprise releases

Contact and Social Media Information:

  • Website: pandorafms.com
  • Facebook: www.facebook.com/pandorafms
  • Twitter: x.com/pandorafms
  • LinkedIn: www.linkedin.com/company/pandora-pfms
  • App Store: apps.apple.com/ru/app/pandora-fms
  • Google Play: play.google.com/store/apps/pandorafmsmobile
  • Address: C/ José Echegaray 8, Alvia, Edificio I, planta 2, Oficina 12. 28232 Las Rozas de Madrid, Madrid, España
  • Phone: +34 91 559 72 22

Wrapping It Up

At the end of the day, there’s no single winner that magically fits every team. Netdata nails that instant, no-fuss view of one machine, but the second you have more than a handful of boxes, or you need real alerting, retention that doesn’t eat your disk alive, or dashboards that don’t make your eyes bleed, you’re shopping for something else.

Some people go for the big all-in-one platforms because they’re tired of running five different tools and just want everything in one place. Others stick to the lightweight metrics collector plus a separate visualization layer because that combo scales exactly how they need it in container land. Then there’s the crowd that finally throws in the towel and picks one of the paid SaaS options because getting paged at midnight stops being fun real quick.

Truth is, a ridiculous number of setups I’ve seen are actually hybrids maybe one of these for infrastructure, another for traces and logs, and something on top just to make the graphs look decent. And that’s totally fine. Monitoring always ends up a bit messy because your infrastructure is messy.

So grab whichever one fixes the thing that’s annoying you today. You can bolt on or swap out the rest later when the next pain shows up. Just don’t let yourself get stuck chasing the “perfect” stack forever good enough and stable beats theoretically perfect every single time. Your on-call rotation will thank you.


Contact Us
UK office:
Phone:
Follow us:
A-listware is ready to be your strategic IT outsourcing solution

    Consent to the processing of personal data
    Upload file