Quick Summary: Digital transformation for B2C enables companies to modernize customer experiences through technology adoption, data-driven personalization, and omnichannel engagement. Organizations embracing these changes see improved customer satisfaction, operational efficiency, and competitive positioning. Success requires strategic planning, customer-centric design, and continuous adaptation to evolving consumer expectations in an increasingly digital marketplace.
The business-to-consumer landscape isn’t what it was five years ago. Consumer expectations have shifted dramatically, demanding seamless digital experiences that mirror the convenience and personalization they’ve grown accustomed to in their daily lives.
Digital transformation for B2C companies represents more than simply building a website or launching an app. It’s a fundamental rethinking of how businesses engage with customers across every touchpoint, from initial discovery through post-purchase support.
And here’s the thing—companies that delay this transformation risk losing relevance as competitors build stronger digital capabilities. The gap between digital leaders and laggards continues to widen each year.
Understanding B2C Digital Transformation
Digital transformation in the B2C context involves integrating digital technologies into all areas of consumer-facing operations. This fundamentally changes how companies deliver value and interact with customers.
According to Columbia Business School’s research on customer experience design, the evolution from traditional marketing centered around functional product aspects to comprehensive Customer Experience (CX) design represents a significant strategic shift. Product management that once focused purely on capabilities now prioritizes experience-based approaches.
The shift goes beyond front-end customer interactions. It touches operations, supply chains, data management, and organizational culture. Companies must adapt their entire business model to meet the demands of digitally-native consumers who expect instant access, personalization, and seamless omnichannel experiences.
Why B2C Transformation Differs from B2B
Business-to-consumer transformation faces distinct challenges compared to B2B contexts. Consumer transactions typically involve lower individual values but vastly higher volumes. The purchasing cycle is shorter, often impulsive, and heavily influenced by emotional factors rather than rational evaluation.
B2C customers expect immediate gratification. They won’t tolerate complex navigation, slow load times, or fragmented experiences across devices. The bar is set by industry leaders—every B2C company competes against the seamless experiences delivered by major platforms, regardless of industry.
Data from Forrester reveals that just 25% of privacy decision-makers report collaboration between their organization’s privacy team and marketing departments. This presents significant risk for B2C companies where marketing is inherently customer-facing and data-intensive.
Digital Transformation for B2C Businesses
B2C companies need fast, scalable, and secure systems to serve customers effectively. A-listware helps implement modern platforms and provides long-term engineering support.
Core areas:
- e-commerce and mobile apps
- customer engagement and CRM tools
- data analytics and personalization
- secure cloud infrastructure
The team can augment your staff or manage entire projects. Start your B2C transformation with A-listware today.
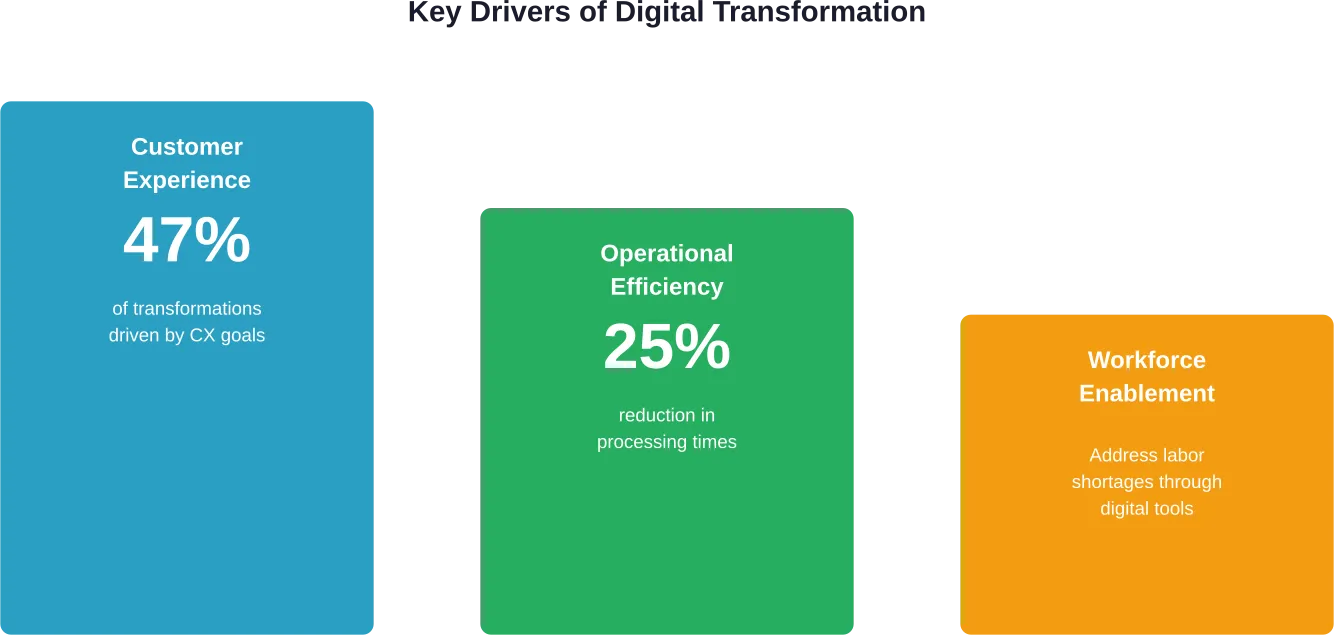
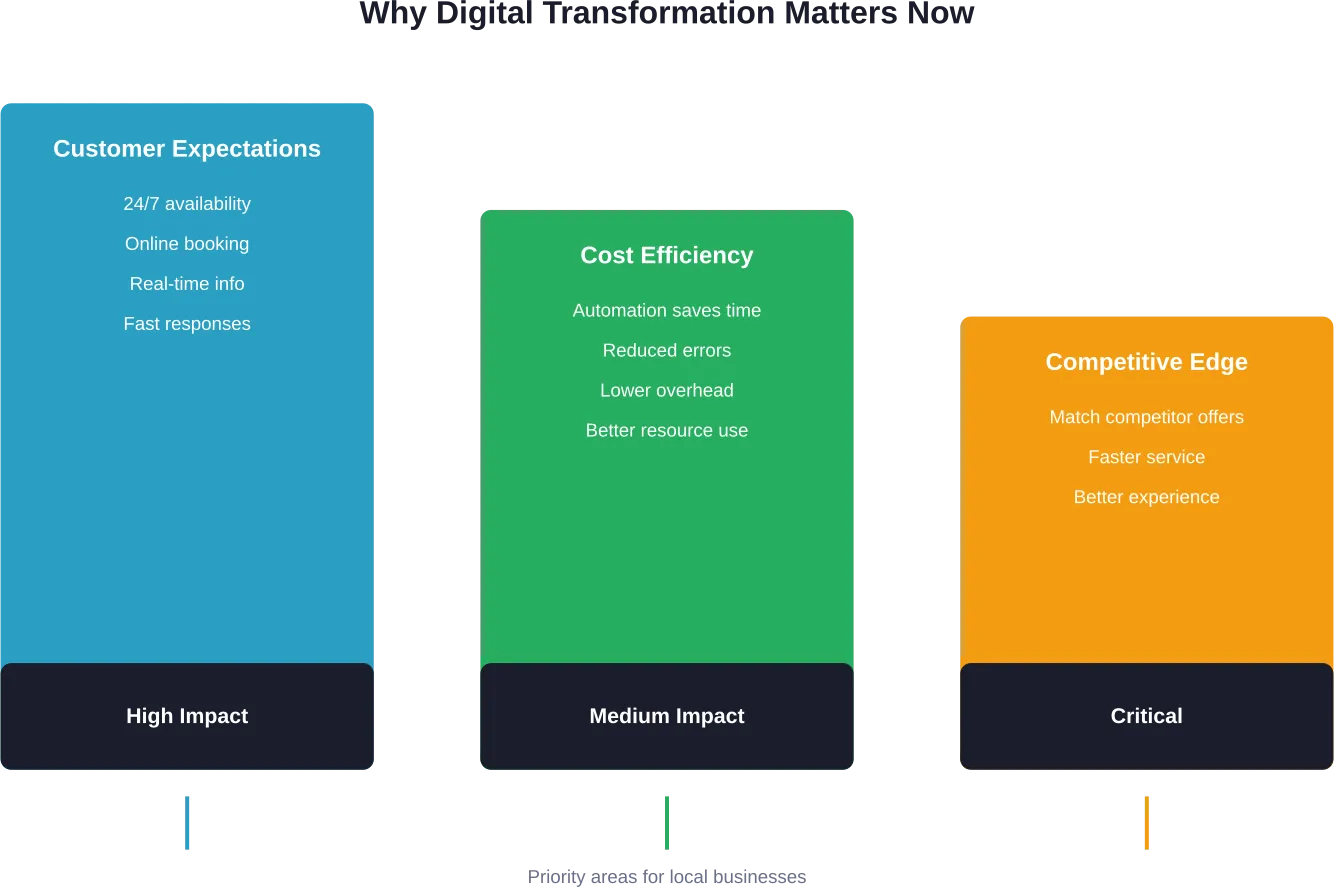
Key Drivers Reshaping B2C Commerce
Several forces are accelerating digital transformation across consumer markets. Understanding these drivers helps prioritize transformation initiatives and allocate resources effectively.
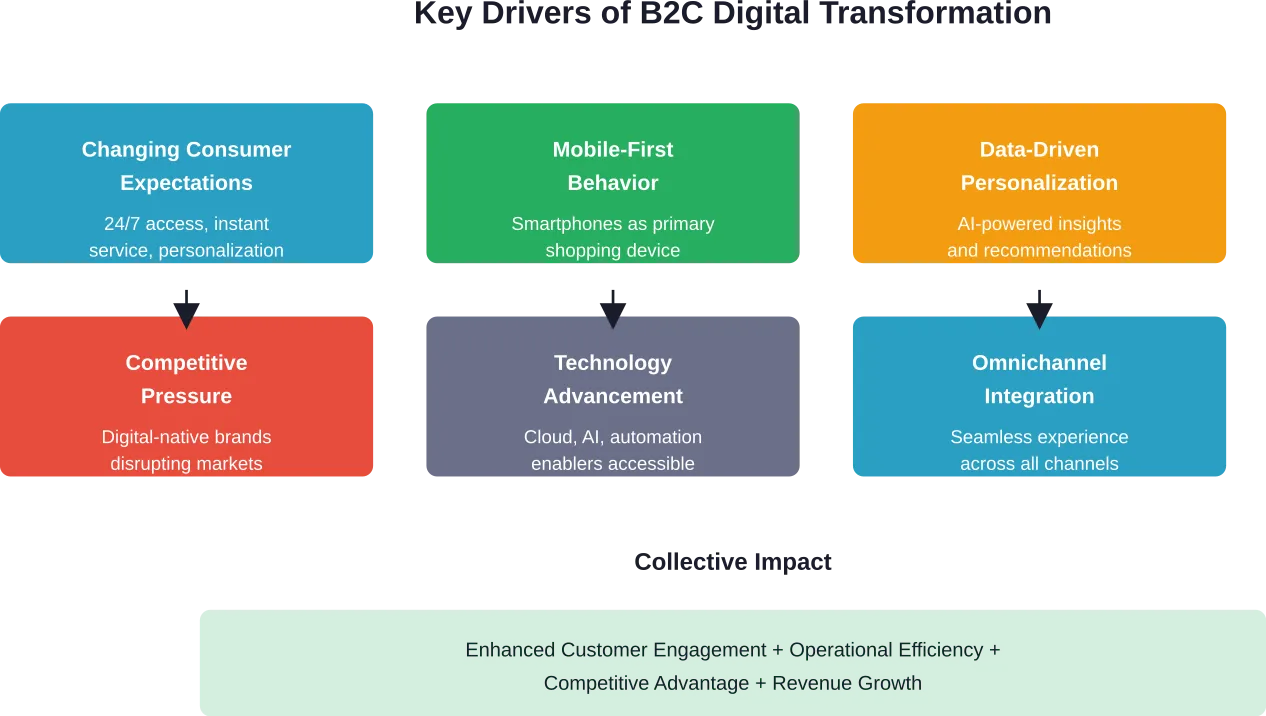
Consumer Expectations Continue Rising
Consumers now expect brands to know their preferences, anticipate their needs, and deliver consistent experiences whether they’re shopping via mobile app, website, social media, or physical store. This expectation extends beyond the transaction itself to include customer service, returns, and ongoing engagement.
Dartmouth’s research on digital customers highlights how digital technologies have fundamentally tipped the balance of power toward consumers. They use digital tools to gather information and evaluate options for spending, demanding that corporations respond with improved customer experiences, competitive pricing, and increased alignment with customer values.
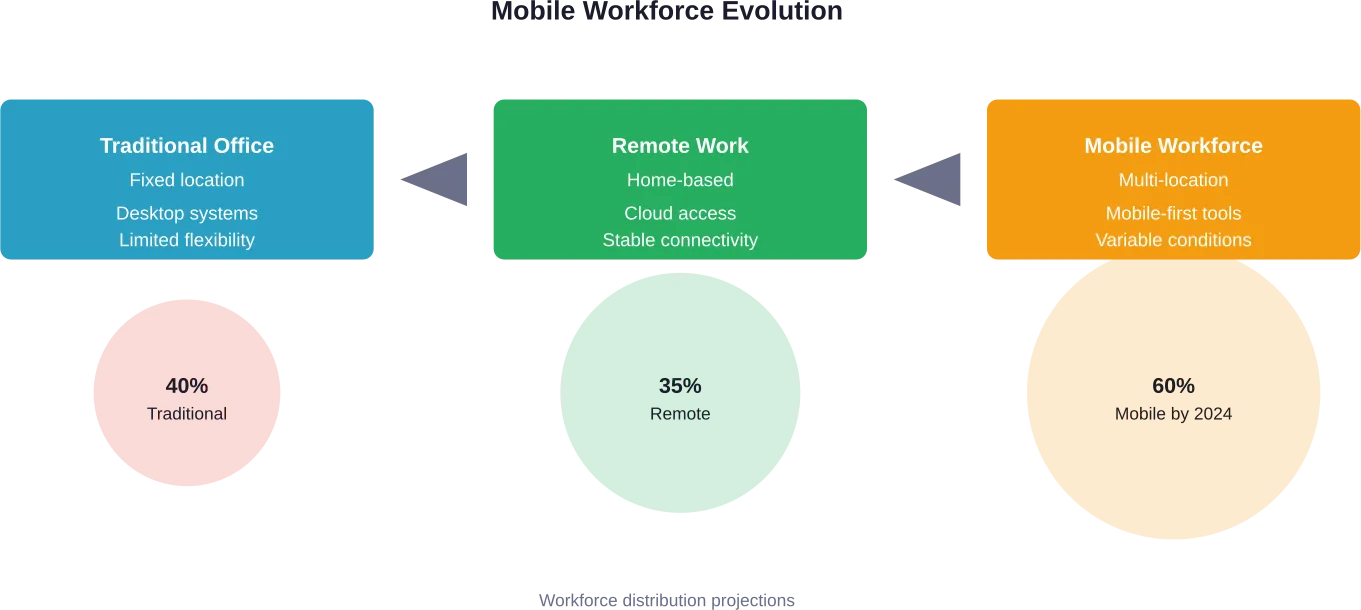
Mobile as the Primary Channel
The smartphone has become the central device for consumer interactions. Companies must optimize every digital touchpoint for mobile experiences, not as an afterthought but as the primary design consideration.
Mobile-first design isn’t just about responsive layouts. It encompasses payment options, navigation patterns, load times, and content formatting that acknowledges how consumers actually use their devices throughout the day.
Data and Personalization Demands
Consumers increasingly expect personalized recommendations, targeted offers, and content that reflects their individual preferences and purchase history. This requires sophisticated data collection, analysis, and application across all customer touchpoints.
But here’s where it gets complicated. Privacy concerns and regulations create tension between personalization desires and data protection requirements. Forrester data shows only 25% of privacy teams collaborate effectively with marketing departments, creating gaps in how organizations handle customer data responsibly while still delivering personalized experiences.
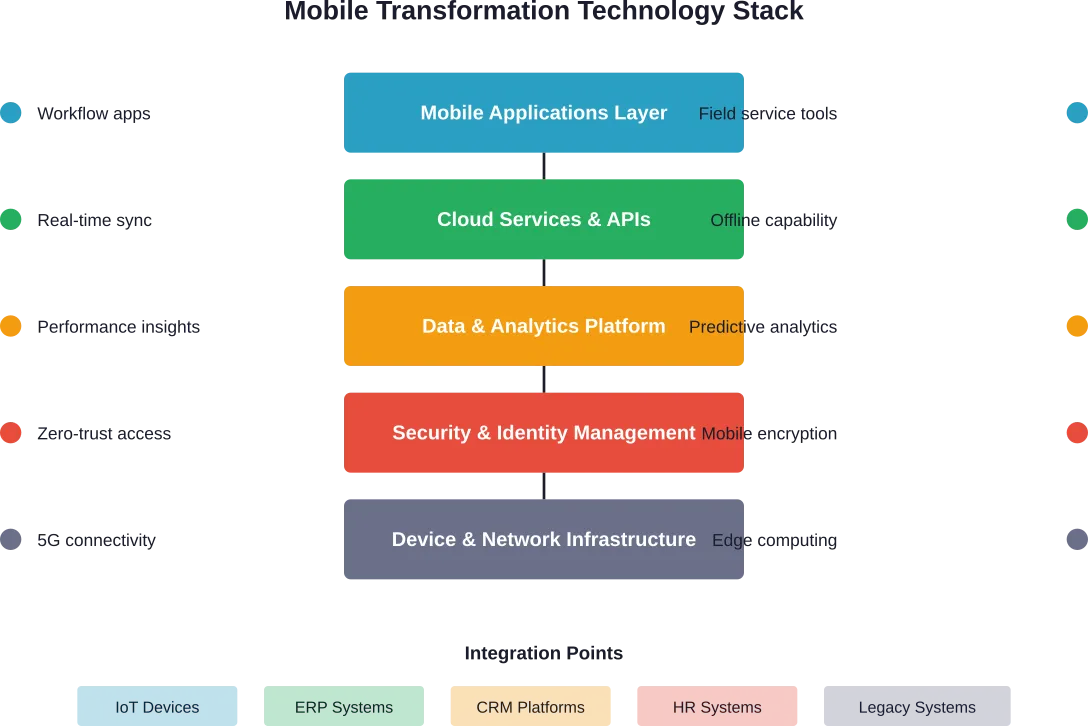
Core Components of B2C Digital Transformation
Successful transformation initiatives share several common elements. These components work together to create cohesive digital experiences that drive business results.
| Component | Description | Business Impact |
|---|---|---|
| Customer Data Platform | Unified customer profiles across touchpoints | Enables personalization and consistent experiences |
| Omnichannel Commerce | Seamless shopping across web, mobile, social, physical | Increases conversion rates and customer satisfaction |
| Marketing Automation | Triggered communications based on behavior | Improves engagement and reduces manual effort |
| AI and Analytics | Predictive insights and recommendations | Optimizes inventory, pricing, and customer targeting |
| Digital Payments | Multiple payment options including digital wallets | Reduces friction and abandoned transactions |
| Customer Service Tech | Chatbots, self-service portals, AI-assisted support | Lowers costs while improving response times |
Experience-Based Approach Over Capabilities
Columbia Business School’s research on customer experience design highlights a critical shift in strategy. One case study described according to Columbia Business School research, a company with low brand awareness and a complicated product shifted from a capabilities-based approach to an experience-based approach on a budget of no more than $300,000.
This experience-focused design enabled significant customer engagement improvements. The lesson? Digital transformation doesn’t necessarily require massive budgets—it requires strategic thinking about how to design experiences that resonate with customers.
Building Collaborative Ecosystems
MIT Sloan Management Review’s research on collaborative ecosystems emphasizes that transformation increasingly requires partnerships across the value chain. B2C companies can’t build everything in-house.
Strategic partnerships with technology providers, logistics companies, payment processors, and data analytics firms enable faster transformation and access to specialized capabilities without the overhead of building proprietary solutions for every need.
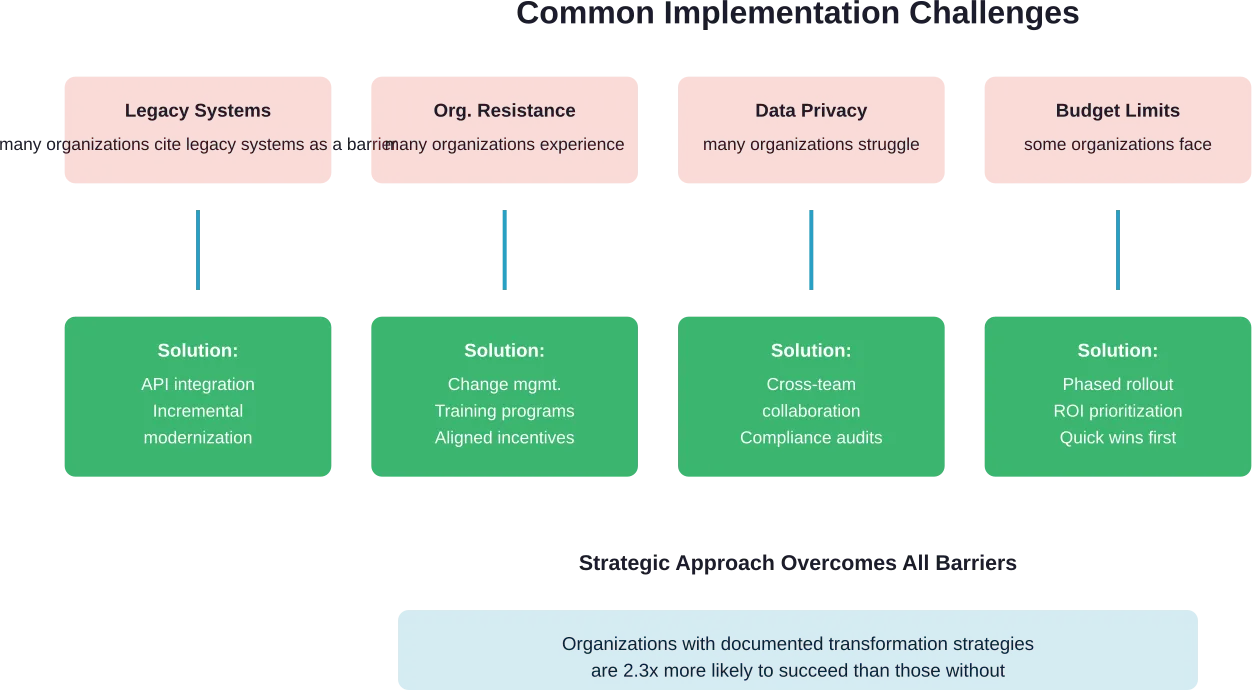
Implementation Challenges and Solutions
Digital transformation isn’t a straight path. Organizations encounter predictable obstacles that can derail initiatives or extend timelines significantly.
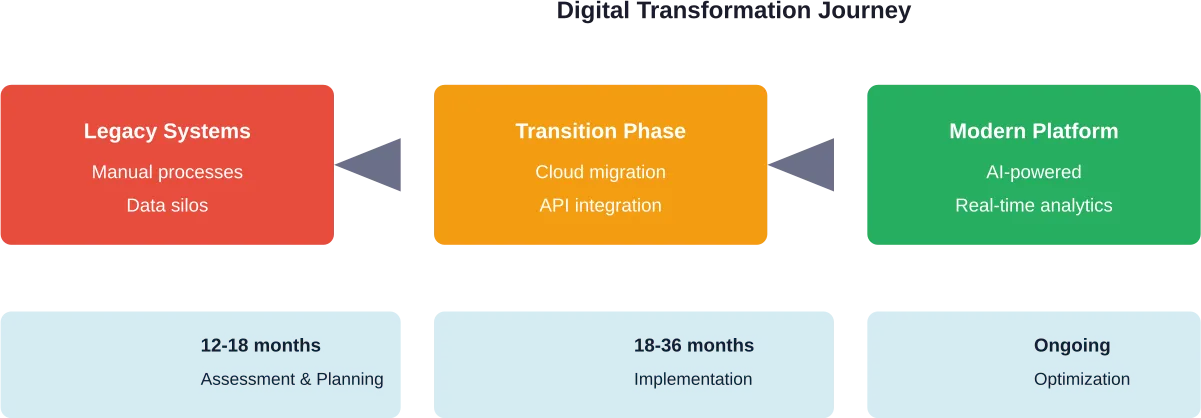
Legacy System Integration
Many B2C companies operate on outdated technology infrastructure that wasn’t designed for modern digital experiences. These legacy systems often can’t integrate easily with new digital platforms, creating data silos and operational inefficiencies.
The solution involves incremental modernization rather than wholesale replacement. API layers can connect old and new systems while gradually migrating functions to modern platforms. This approach reduces risk and maintains business continuity during transformation.
Organizational Resistance
Digital transformation requires cultural change, not just technology implementation. Employees accustomed to traditional processes may resist new workflows, tools, and performance metrics.
Successful organizations invest in change management from the project’s start. This includes clear communication about transformation goals, training programs that build digital skills, and incentive structures aligned with new ways of working.
Data Privacy and Compliance
Regulations like the FTC’s INFORM Consumers Act and CAN-SPAM Act establish requirements for how B2C companies collect, store, and use customer data. Non-compliance carries significant penalties.
According to FTC guidance, According to FTC guidance, the CAN-SPAM Act applies to all commercial messages (including email) where the primary purpose is commercial advertisement or promotion, not just bulk email Companies must provide clear opt-out mechanisms and honor unsubscribe requests promptly.
For high-volume online sellers, the INFORM Consumers Act requires online marketplaces to verify seller information and make certain details publicly available. This impacts B2C companies selling through third-party platforms.
Skill Gaps and Talent Shortage
Digital transformation requires capabilities many traditional B2C organizations lack internally. Data science, UX design, cloud architecture, and digital marketing automation all demand specialized skills.
Organizations address this through combinations of hiring, training existing staff, and partnering with specialized agencies or consultants. Some also leverage offshore development and support teams to access global talent pools at different cost structures.
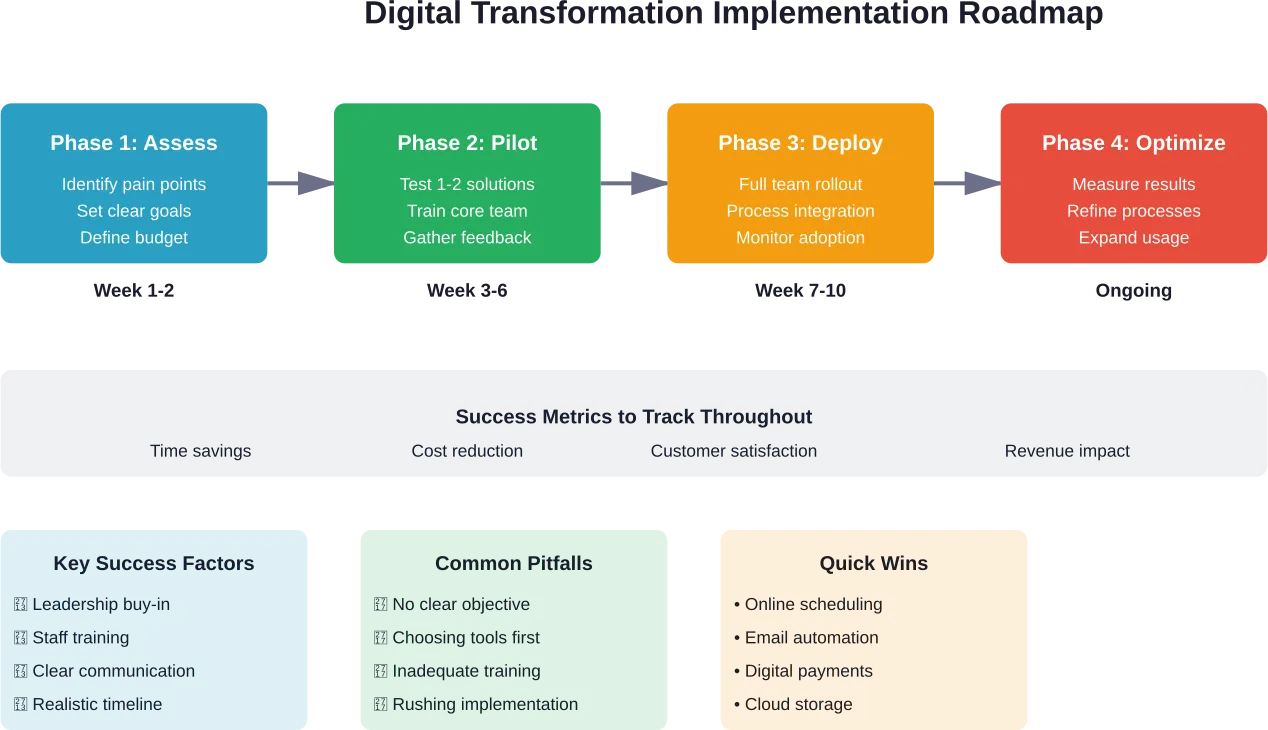
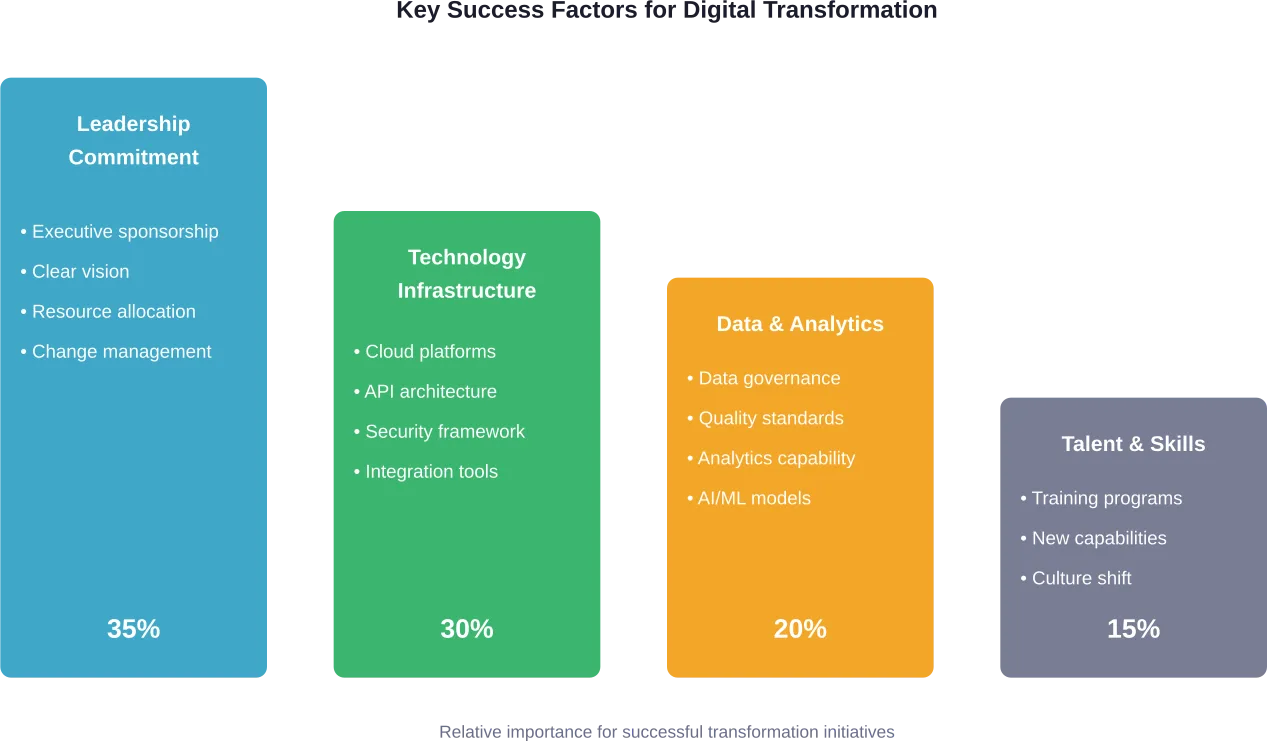
Strategies for Successful B2C Transformation
Organizations that navigate transformation successfully follow patterns that minimize risk while maximizing business impact.
Start with Customer Journey Mapping
Before implementing new technology, map current customer journeys across all touchpoints. Identify pain points, moments of friction, and opportunities for enhancement.
This customer-centric approach ensures transformation efforts address real problems rather than implementing technology for technology’s sake. It also helps prioritize initiatives based on customer impact rather than internal preferences.
Adopt an Agile, Iterative Approach
Traditional waterfall project management doesn’t work well for digital transformation. Requirements change, technologies evolve, and customer expectations shift during multi-year initiatives.
Agile methodologies allow organizations to deliver value incrementally, learn from each release, and adjust priorities based on results. This reduces risk and maintains organizational momentum even when specific initiatives don’t deliver expected results.
Measure What Matters
Define clear success metrics before launching transformation initiatives. These should connect to business outcomes—customer lifetime value, conversion rates, average order value, customer satisfaction scores—rather than vanity metrics like page views or social media followers.
Regular measurement and reporting keep initiatives accountable and provide early warning when adjustments are needed. But don’t over-measure. Focus on the 5-7 metrics that truly indicate whether transformation is working.
| Strategy Element | Implementation Approach | Success Indicator |
|---|---|---|
| Customer-Centric Design | Journey mapping, persona development, continuous feedback | Improved satisfaction scores, reduced support tickets |
| Technology Foundation | Cloud infrastructure, API-first architecture, scalable platforms | System uptime, integration speed, scalability metrics |
| Data-Driven Decisions | Analytics implementation, A/B testing, customer insights | Conversion rate improvements, personalization effectiveness |
| Organizational Alignment | Cross-functional teams, clear governance, executive sponsorship | Project velocity, employee satisfaction, adoption rates |
| Continuous Improvement | Regular retrospectives, experimentation culture, learning loops | Innovation rate, time-to-market for new features |
Invest in Change Management
Technology implementation represents maybe 30% of transformation work. The remaining 70% involves people, processes, and culture.
Change management starts with executive sponsorship and cascades through the organization. Clear communication about why transformation matters, how it will unfold, and what it means for different roles helps reduce resistance and build momentum.
The Role of Marketing in B2C Transformation
Marketing sits at the intersection of customer experience and business technology, making it central to transformation efforts.
Forrester’s research on B2C marketing transformation emphasizes that marketing leaders must navigate AI disruption, market fragmentation, and evolving measurement challenges. The fundamentals of B2C marketing remain important, but the execution requires new capabilities and approaches.
Brand Building in Digital Channels
Digital transformation doesn’t eliminate the need for strong brands. In fact, as digital channels proliferate and consumer attention fragments, distinctive brands become even more valuable.
B2C companies must find ways to build brand awareness and affinity through digital channels—content marketing, social media engagement, influencer partnerships, and community building. This requires different skills than traditional brand advertising but serves the same fundamental purpose.
Navigating AI and Automation
Generative AI creates both opportunities and challenges for B2C marketers. It enables content creation at scale, personalized customer interactions, and sophisticated predictive analytics.
But it also changes how consumers discover products. Search behavior is evolving as AI-powered tools provide direct answers rather than lists of links. B2C companies must adapt their digital presence to remain discoverable in this changing environment.
Emerging Trends Shaping B2C Digital Future
Digital transformation isn’t a destination—it’s an ongoing process of adaptation as technology and consumer behavior continue evolving.
Social Commerce Integration
Social media platforms increasingly function as commerce channels, not just marketing channels. Consumers discover products, research options, make purchases, and share reviews all within social environments.
B2C companies must integrate social commerce into their broader digital strategy, creating shoppable content and seamless checkout experiences within social platforms while maintaining consistent branding across all channels.
Voice and Conversational Commerce
Voice assistants and conversational AI are changing how consumers interact with brands. While adoption has been slower than early predictions suggested, voice-activated shopping and customer service continue growing.
Companies preparing for this shift focus on conversational design principles, natural language processing capabilities, and voice search optimization for their digital content.
Sustainability and Values Alignment
Dartmouth’s research on digital customers notes that corporations must demonstrate increased alignment with customer values. Consumers increasingly consider brand values and sustainability practices in purchase decisions.
Digital transformation enables greater transparency about supply chains, sourcing practices, and environmental impact. B2C companies that effectively communicate their values and practices through digital channels build stronger customer relationships.
Measuring Transformation Success
How do organizations know whether their transformation efforts are working? Clear metrics tied to business outcomes provide the answer.
Customer Experience Metrics
Net Promoter Score (NPS), Customer Satisfaction (CSAT), and Customer Effort Score (CES) all measure different aspects of experience quality. Track these consistently before and after transformation initiatives to quantify impact.
Digital-specific metrics like app ratings, website usability scores, and customer journey completion rates provide additional insight into how well digital touchpoints perform.
Business Performance Indicators
Transformation must ultimately drive business results. Track metrics like conversion rates, average order value, customer lifetime value, and customer acquisition cost.
Compare these metrics across customer segments, channels, and time periods to understand where transformation delivers the most value and where additional work is needed.
Operational Efficiency Gains
Digital transformation should also improve operational efficiency. Monitor metrics like order processing time, customer service resolution rates, inventory turnover, and operational cost per transaction.
These efficiency gains often fund continued transformation investments, creating a virtuous cycle of improvement.
Frequently Asked Questions
- What is digital transformation for B2C companies?
Digital transformation for B2C involves integrating digital technologies throughout consumer-facing operations to fundamentally change how companies deliver value and interact with customers. This includes modernizing systems, creating seamless omnichannel experiences, leveraging data for personalization, and adopting customer-centric design principles across all touchpoints.
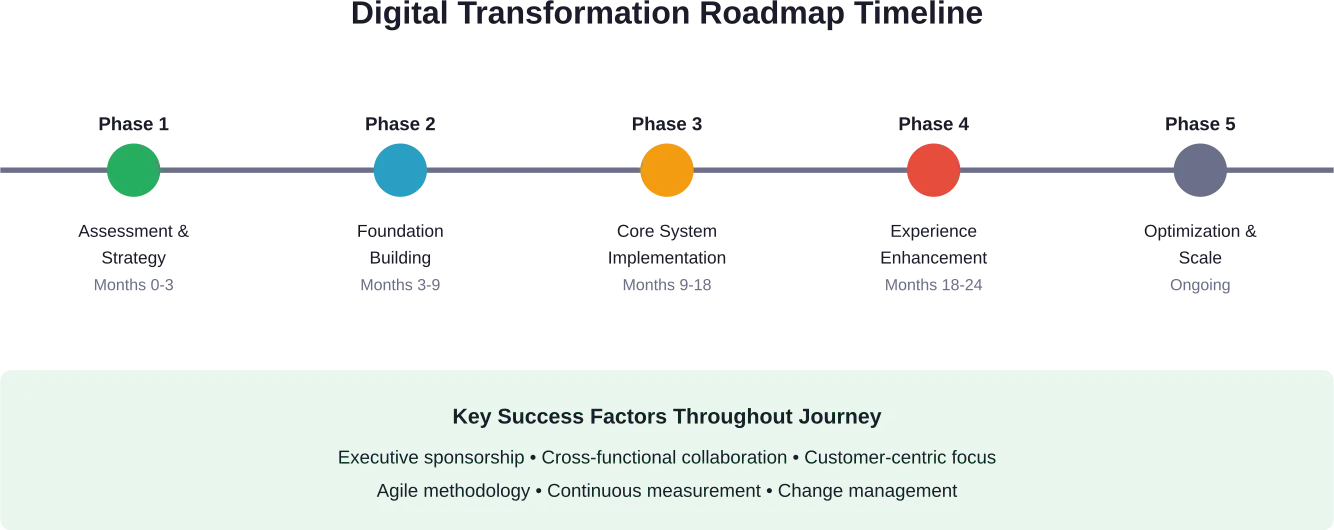
- How long does B2C digital transformation take?
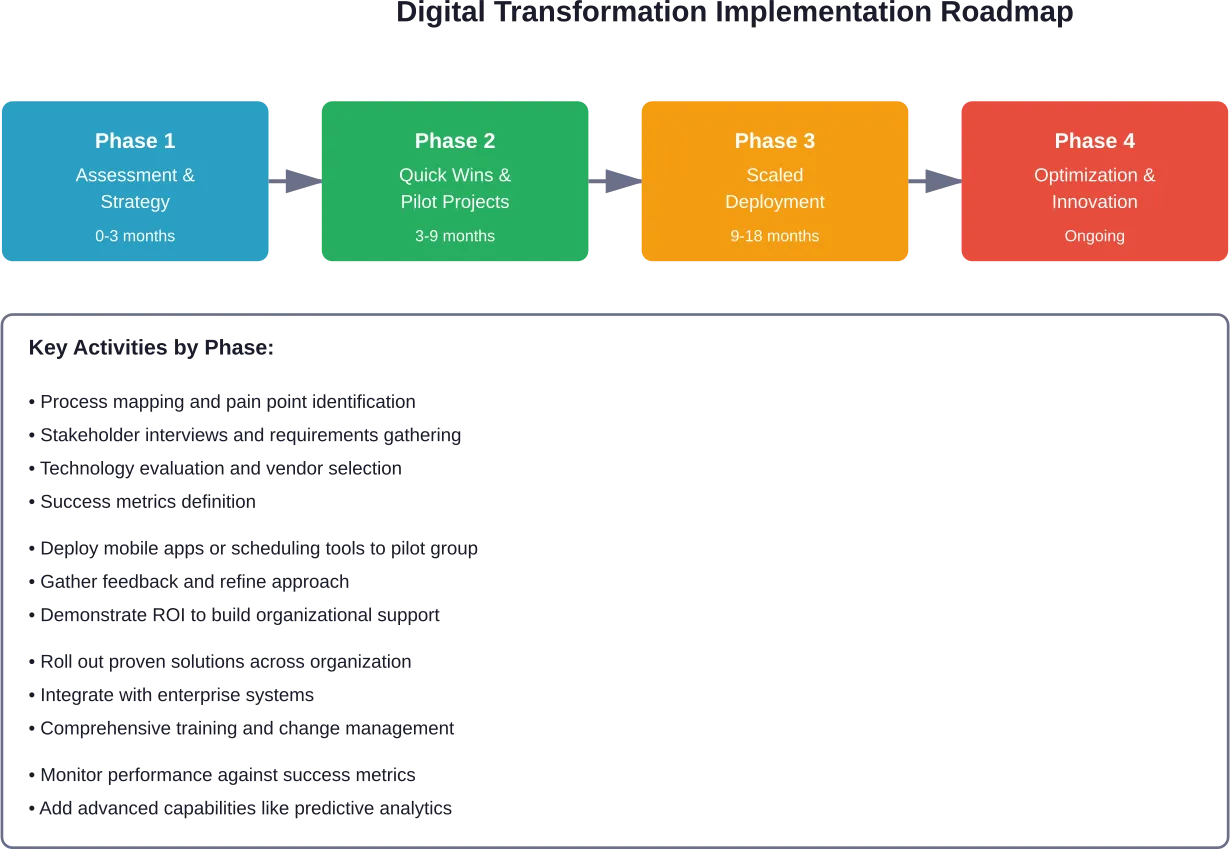
Most comprehensive B2C digital transformations require 18-24 months for core implementation, though organizations should view transformation as an ongoing process rather than a one-time project. Quick wins can be achieved in 3-6 months through focused initiatives, while building foundational capabilities typically takes 9-12 months. The timeline varies based on organization size, legacy system complexity, and transformation scope.
- What are the biggest challenges in B2C digital transformation?
The most common challenges include legacy system integration, organizational resistance to change, data privacy compliance, budget constraints, and skill gaps. Many organizations also struggle with defining clear success metrics and maintaining executive support throughout multi-year initiatives. Addressing these challenges requires strategic planning, change management investment, and phased implementation approaches.
- How much does B2C digital transformation cost?
Transformation costs vary dramatically based on company size and scope. Columbia Business School research highlighted successful customer experience transformation on budgets around $300,000 for smaller initiatives, while enterprise-wide transformations at large B2C companies can require investments of several million dollars. Most organizations should budget 2-5% of annual revenue for meaningful transformation work.
- Do B2C companies need to rebuild their entire technology stack?
Complete technology replacement isn’t necessary or advisable for most organizations. Successful transformations typically involve incremental modernization—adding API layers to connect legacy systems with modern platforms, migrating specific functions to cloud-based solutions, and gradually replacing outdated systems as business priorities dictate. This approach reduces risk while maintaining business continuity.
- How does B2C digital transformation differ from B2B?
B2C transformation focuses on high-volume, lower-value transactions with shorter decision cycles and more emotional purchase drivers. Consumer expectations around speed, convenience, and personalization are higher, influenced by leading digital platforms. B2C also deals with larger customer bases, requiring more scalable systems and different data management approaches compared to B2B contexts.
- What role does marketing play in B2C digital transformation?
Marketing sits at the center of B2C transformation, connecting customer experience with business technology. Forrester research shows marketing leaders must navigate AI disruption, evolving measurement practices, and market fragmentation while maintaining brand building fundamentals. Marketing teams drive customer data strategy, omnichannel experience design, and digital engagement tactics that directly impact transformation success.
Moving Forward with Digital Transformation
Digital transformation for B2C companies represents a strategic imperative, not an optional initiative. Consumer expectations continue rising, competitive pressure intensifies, and technology capabilities expand—organizations that don’t adapt risk losing relevance.
But transformation doesn’t require massive budgets or wholesale replacement of existing operations. The most successful initiatives start with clear customer-centric goals, build foundational capabilities incrementally, and maintain organizational focus through executive sponsorship and change management.
The path forward involves mapping current customer journeys, identifying high-impact opportunities, selecting appropriate technologies, and implementing changes through agile methodologies that allow learning and adjustment. Success requires patience, persistence, and willingness to adapt as circumstances change.
Organizations that embrace digital transformation thoughtfully position themselves for sustainable growth in increasingly digital markets. Those that delay face mounting challenges as the gap between digital leaders and laggards continues widening. The time to begin isn’t when transformation becomes comfortable—it’s now.