Quick Summary: Digital transformation for field services involves implementing mobile technologies, IoT sensors, AI-powered analytics, and automation tools to modernize field operations. According to recent research, organizations using these technologies report up to 25% productivity increases and 70% reductions in equipment breakdowns through predictive maintenance capabilities.
Inefficient scheduling. Communication breakdowns. Mountains of paperwork.
Field service organizations deal with these headaches daily while budgets tighten and the skilled labor shortage worsens. But here’s the thing—digital transformation isn’t just another buzzword. It’s fundamentally changing how field service operations function, and organizations that embrace it are seeing measurable results.
Research shows nearly half of all digital transformations prioritize uniquely better customer experiences as their primary driver. The pressure comes from both sides: customers and employees now demand the digital technologies they use in everyday life.
Field service management has grown more complex. Technicians work across multiple locations, equipment grows more sophisticated, and service expectations rise constantly. Traditional methods simply can’t keep pace.
What Is Digital Transformation in Field Service?
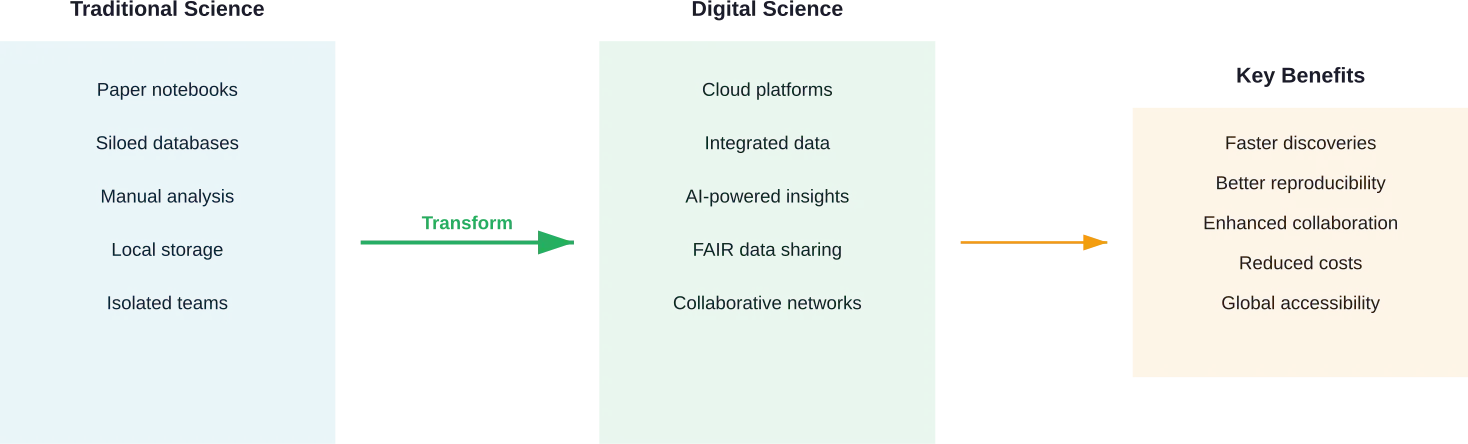
Digital transformation in field service refers to the comprehensive coordination and optimization of tasks, resources, and personnel through modern technology. It encompasses everything from planning service visits and resource management to scheduling and supporting engineers working at customer sites.
The ultimate goal? Streamline field operations, improve response times, and deliver better service outcomes.
But this goes deeper than swapping paper forms for tablets. Real transformation integrates multiple technologies—IoT sensors, artificial intelligence, cloud platforms, and mobile applications—into a cohesive system that fundamentally changes how work gets done.
Field Service Management (FSM) software sits at the center of this transformation. These platforms connect dispatchers, technicians, customers, and backend systems in real-time, creating visibility that was impossible with legacy approaches.
Modern field service operations increasingly require integrated IoT, AI, and cloud technologies to function effectively where different systems communicate seamlessly.
Why Field Service Organizations Are Embracing Digital Technologies
The business case for digital transformation in field service operations rests on several concrete benefits that directly impact the bottom line.
Enhanced Customer Satisfaction
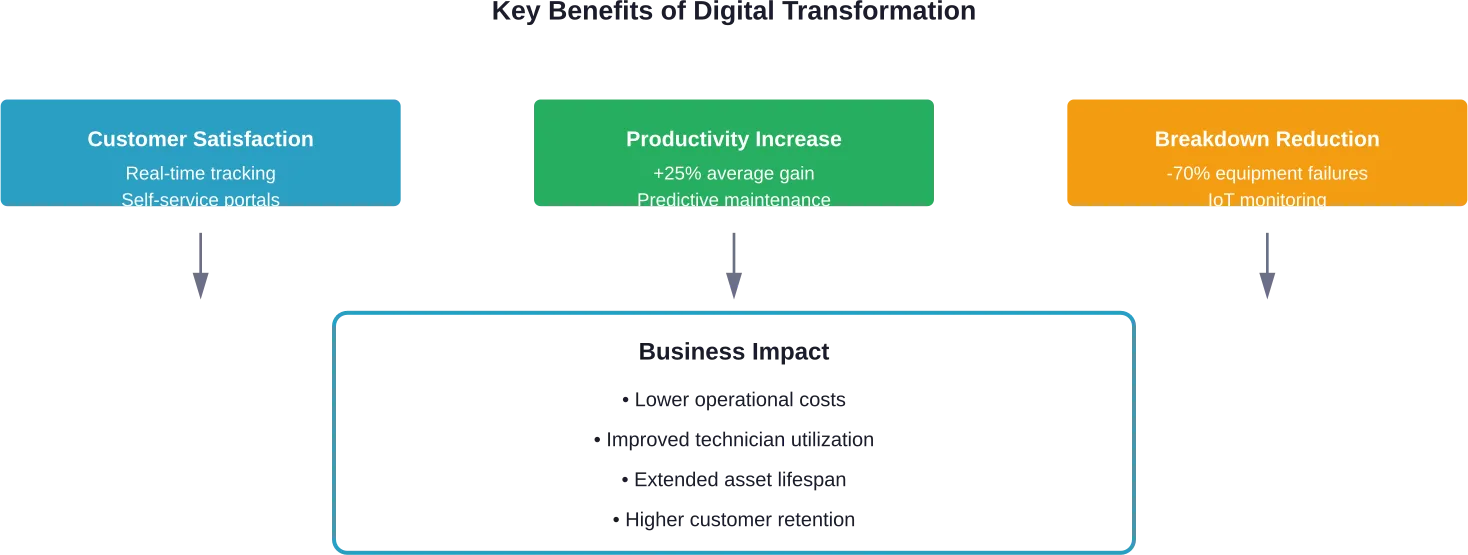
Nearly half of all digital transformations cite better customer experiences as the key driving factor. Customers want accurate arrival windows, real-time updates, and first-time fix rates that actually meet expectations.
Digital tools deliver on these expectations. Mobile apps let customers track technician location in real-time. Automated notifications keep them informed throughout the service journey. Self-service portals allow them to schedule appointments, access service history, and resolve simple issues without waiting for a technician.
According to Deloitte’s 2026 Field Service Report, 50% of organizations offer self-service but only 31% deliver “optimized” self-service experiences. That gap represents both a challenge and an opportunity.
Operational Efficiency and Productivity Gains
Based on a Deloitte study, predictive maintenance increases productivity by 25% on average and reduces breakdowns by 70%. These aren’t marginal improvements—they’re transformative changes that directly affect profitability.
Predictive maintenance extends asset lifespan, reduces accident risks, lowers repair costs, and increases field technician productivity. IoT sensors monitor equipment continuously, identifying potential failures before they occur. AI algorithms analyze patterns to schedule preventive maintenance at optimal times.
The efficiency gains extend beyond maintenance. Digital scheduling tools optimize routes automatically, reducing drive time and fuel costs. Mobile applications give technicians instant access to equipment manuals, service histories, and parts inventories.
Data-Driven Decision Making
Traditional field service operations ran on gut instinct and incomplete information. Digital transformation changes that fundamentally by providing comprehensive data on every aspect of operations.
Organizations can now track key performance indicators in real-time: first-time fix rates, average service duration, technician utilization, customer satisfaction scores, and equipment reliability metrics. This visibility enables continuous improvement based on actual performance data rather than assumptions.
Analytics platforms identify patterns that humans might miss. Which equipment models fail most frequently? Which technicians consistently deliver the best outcomes? What service windows yield highest customer satisfaction? These insights drive smarter resource allocation and strategic planning.

Core Technologies Driving Field Service Transformation
Several technologies work together to enable comprehensive digital transformation in field service operations. Understanding how they interconnect helps organizations build effective technology stacks.
Mobile Field Service Applications
Mobile technology fuels agile field service operations. Technicians equipped with tablets or smartphones access critical information anywhere: work orders, customer histories, equipment specifications, and troubleshooting guides.
Modern mobile apps enable two-way communication between field staff and dispatchers. Status updates flow automatically as technicians complete tasks. Photos and videos document equipment conditions. Digital signatures capture customer approval instantly.
The mobility advantage extends beyond information access. GPS integration enables real-time location tracking, optimized routing, and accurate arrival time estimates. Offline capabilities ensure technicians work effectively even without connectivity, syncing data once connections restore.
Internet of Things (IoT) Sensors
IoT sensors transform field service from reactive to proactive. Connected equipment monitors itself continuously, reporting performance metrics, usage patterns, and early warning signs of potential failures.
IoT sensors enable real-time monitoring that transforms operational approaches in field service. Service organizations receive alerts before customers even notice problems.
This shift from scheduled maintenance to condition-based maintenance reduces unnecessary service visits while preventing unexpected breakdowns. Resources focus where they’re actually needed, not where a predetermined schedule dictates.
Artificial Intelligence and Machine Learning
AI capabilities in field service have expanded rapidly. According to Deloitte’s 2026 Field Service Report, 40% of organizations currently use GenAI for analysis, reporting, technician assistance, and task automation.
Machine learning algorithms analyze historical service data to predict equipment failures with increasing accuracy. They optimize scheduling by considering factors like technician skills, parts availability, traffic patterns, and service complexity simultaneously.
AI-powered chatbots handle routine customer inquiries, freeing human agents for complex issues. Intelligent routing systems assign work orders to the most qualified available technician automatically. Recommendation engines suggest optimal repair procedures based on similar past cases.
Visual Remote Assistance
Visual remote assistance technology enables field service technicians to get expert help while solving problems on-site. It also allows customers to alert service organizations to issues without requiring immediate physical investigation.
Augmented reality applications overlay digital information onto physical equipment. A junior technician viewing a complex machine through a tablet sees labeled components, step-by-step repair instructions, and safety warnings superimposed on the real-world view.
Remote experts join service calls virtually, seeing what the on-site technician sees and providing guidance in real-time. This collaboration approach reduces escalations, improves first-time fix rates, and accelerates knowledge transfer.
Cloud-Based Platforms
Cloud infrastructure provides the foundation that connects all these technologies. Centralized platforms aggregate data from mobile apps, IoT sensors, customer systems, and enterprise resource planning tools.
Cloud deployment offers several advantages over on-premises systems: faster implementation, automatic updates, scalability without hardware investments, and accessibility from anywhere with internet connectivity.
Integration capabilities matter enormously. Modern field service management platforms connect with CRM systems, inventory management, billing software, and communication tools through APIs, creating seamless information flow across the organization.
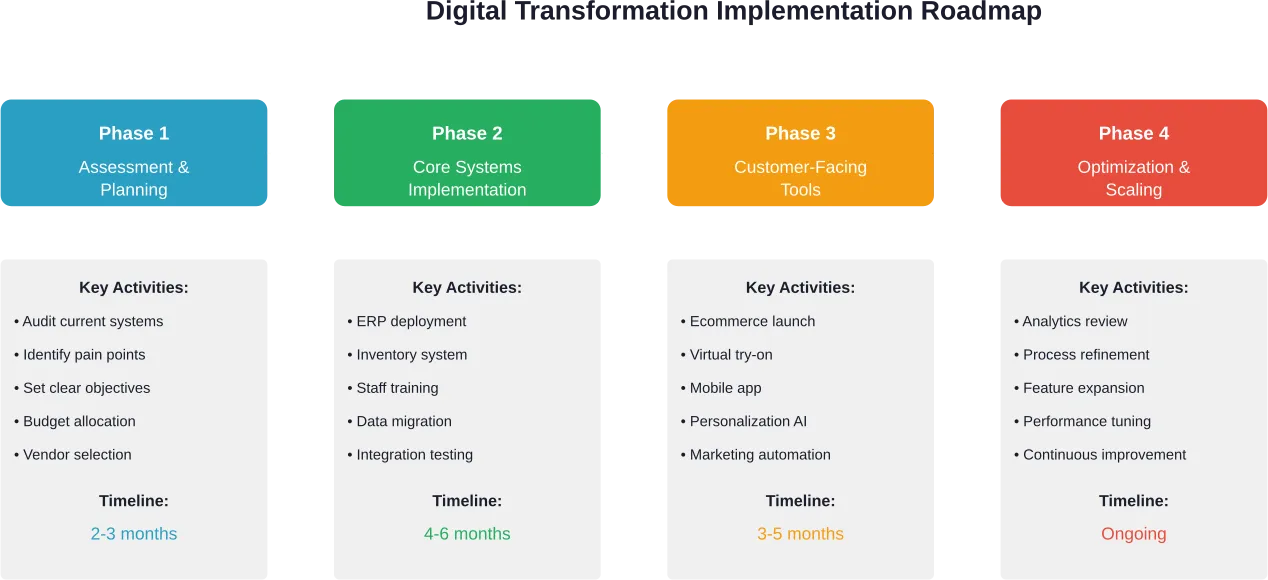
Implementing Digital Transformation in Field Service Operations
Sound familiar—multiple legacy systems, resistance to change, budget constraints? Successfully transforming field service operations requires strategic planning and methodical execution.
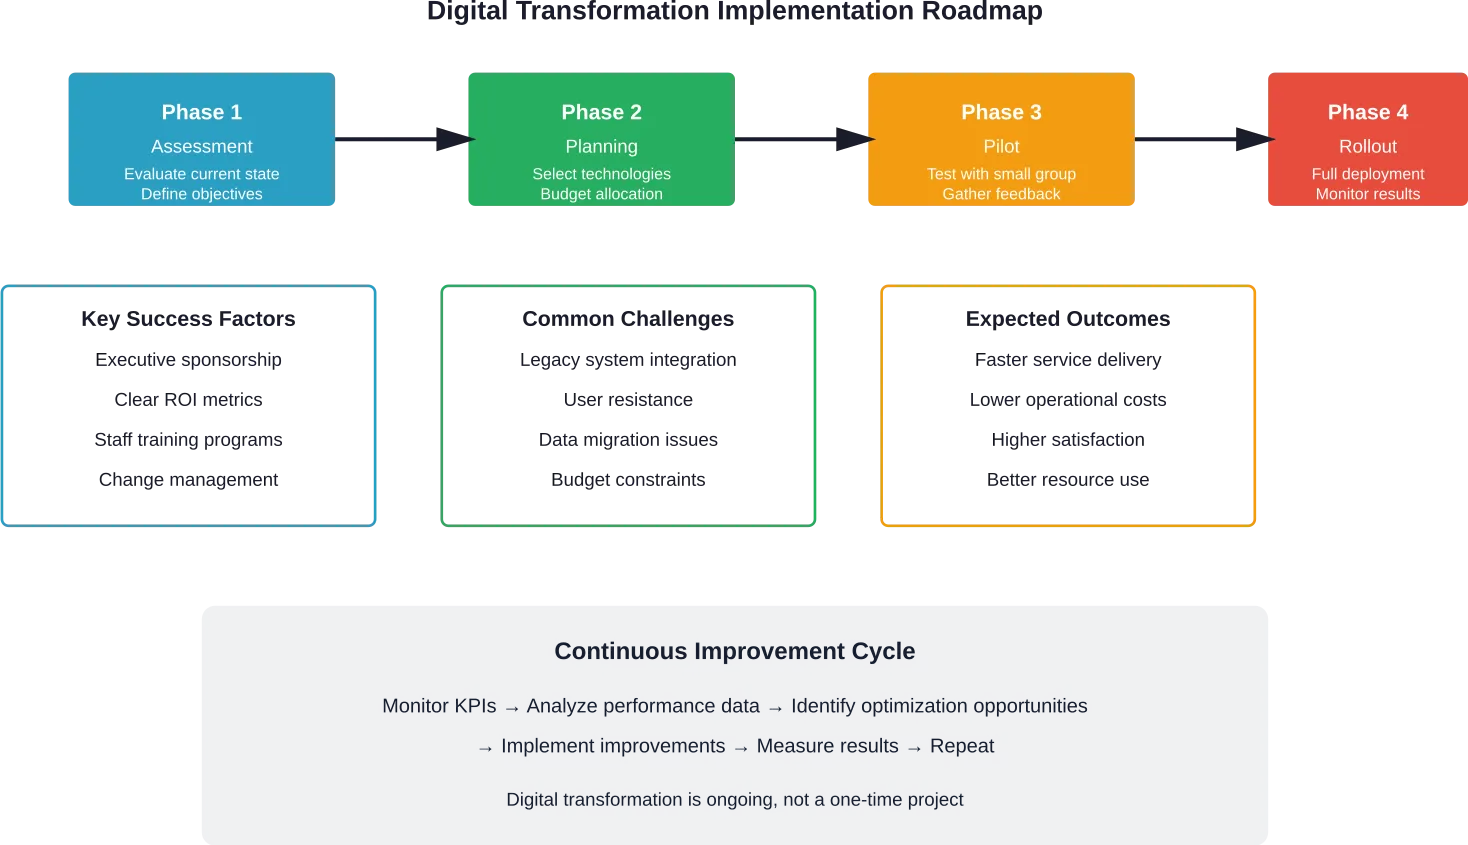
Assess Current State and Define Goals
Transformation starts with honest assessment. Organizations need clear visibility into current performance: What’s the average time to complete service calls? What percentage of jobs require return visits? How satisfied are customers? What do field technicians struggle with most?
Baseline metrics establish the starting point. Specific, measurable goals define success: reduce average service time by 20%, increase first-time fix rate to 85%, improve customer satisfaction scores by 15 points.
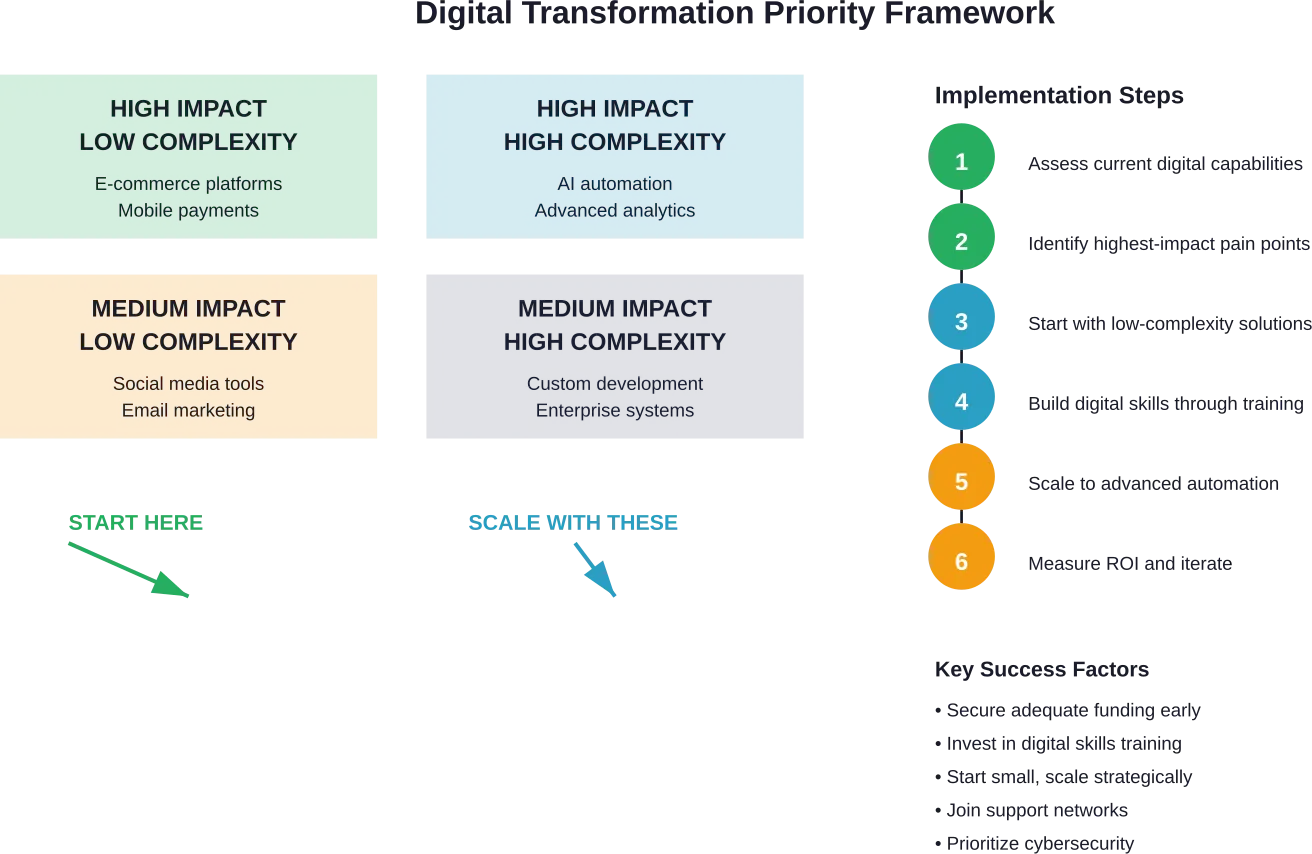
Prioritization matters because transformation doesn’t happen overnight. Which problems create the most pain? Which improvements deliver the biggest impact? Focus efforts where they’ll generate the most value.
Build the Right Technology Stack
Not every organization needs every technology. The right stack depends on specific operational requirements, existing infrastructure, and strategic priorities.
Small operations might start with mobile field service software and cloud-based scheduling. Larger organizations managing complex equipment investments justify IoT sensor networks and predictive analytics platforms.
Integration capabilities deserve serious evaluation. Systems that don’t communicate create data silos and manual workarounds—exactly what digital transformation should eliminate.
| Technology Component | Primary Function | Best For |
|---|
| Mobile FSM Software | Work order management, real-time updates | All field service operations |
| IoT Sensors | Equipment monitoring, predictive maintenance | Organizations managing critical assets |
| AI Analytics | Pattern recognition, optimization | Large-scale operations with substantial data |
| Visual Remote Assistance | Expert collaboration, guided repairs | Complex equipment servicing |
| Customer Portals | Self-service, appointment scheduling | High-volume consumer services |
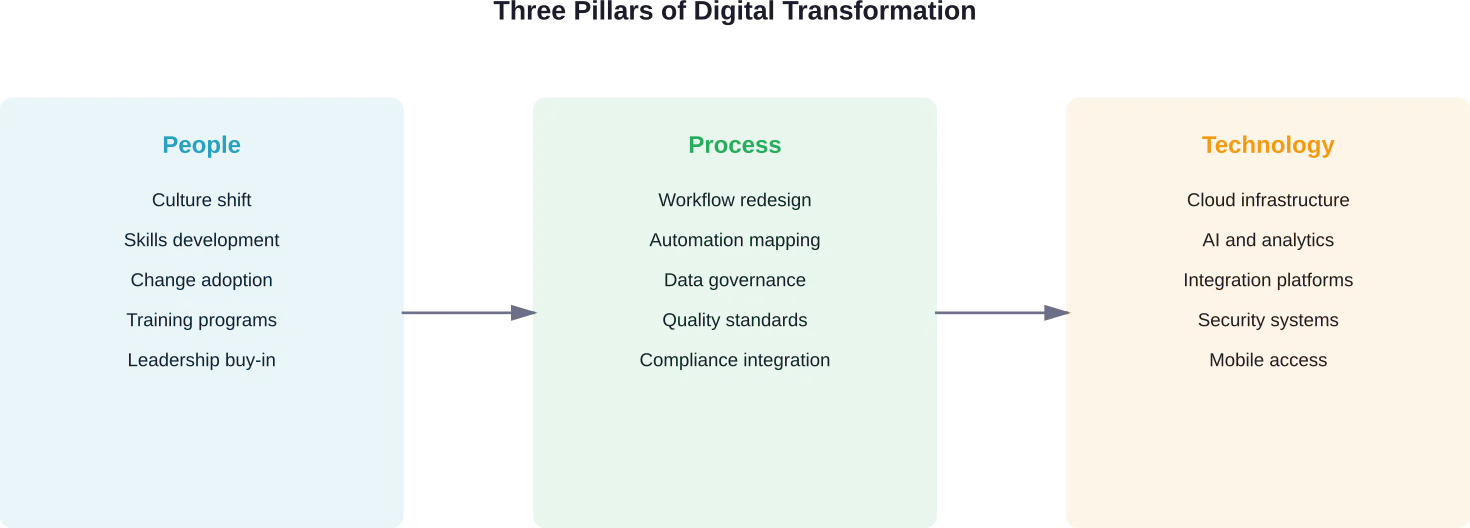
Address Change Management Proactively
Technology implementation fails when human factors get ignored. Field technicians accustomed to paper-based processes need training, support, and compelling reasons to adopt new approaches.
Involve frontline staff early. They understand operational realities that office staff might miss. Their input improves system design and builds buy-in for changes ahead.
Communication matters throughout the transformation journey. Explain why changes are happening, what benefits they’ll deliver, and how they’ll affect daily work. Address concerns honestly rather than dismissing them.
Start with pilot programs before organization-wide rollouts. Test new systems with small groups, gather feedback, refine processes, then expand gradually. Quick wins build momentum and demonstrate value to skeptics.
Focus on Data Quality and Security
Digital transformation generates massive amounts of data. That data only provides value when it’s accurate, complete, and accessible.
Establish data governance practices early. Who’s responsible for data quality? What standards apply? How are errors corrected? Clean data going into systems produces reliable insights coming out.
Security deserves serious attention. Field service systems contain sensitive customer information, proprietary equipment data, and competitive intelligence. According to NIST Special Publication 800-63-4 on digital identity guidelines, proper authentication and access controls are foundational to protecting systems from unauthorized access.
Regular security assessments identify vulnerabilities before they’re exploited. Employee training reduces human error that compromises systems. Backup and recovery procedures ensure business continuity when problems occur.

Fix Field Operations Without Slowing Teams Down
Digital transformation in field services should make coordination easier, not add more layers to already complex operations. A-listware works with companies that need to improve how their systems, processes, and data support day-to-day operations. They start by assessing current workflows, tools, and data flow, then build a transformation plan around how teams operate in real conditions. This usually includes improving system integration, reducing manual input, and making data accessible across locations so decisions can be made faster and with fewer gaps.
For field services, this often means better coordination between office and on-site teams, more reliable reporting, and tools that hold up in real working environments. A-listware covers the full process, from analysis and strategy to implementation and ongoing support, so operations keep running while changes are introduced. If your field workflows feel fragmented or harder to manage than they should be, it makes sense to speak directly with A-listware and look at what can be simplified.
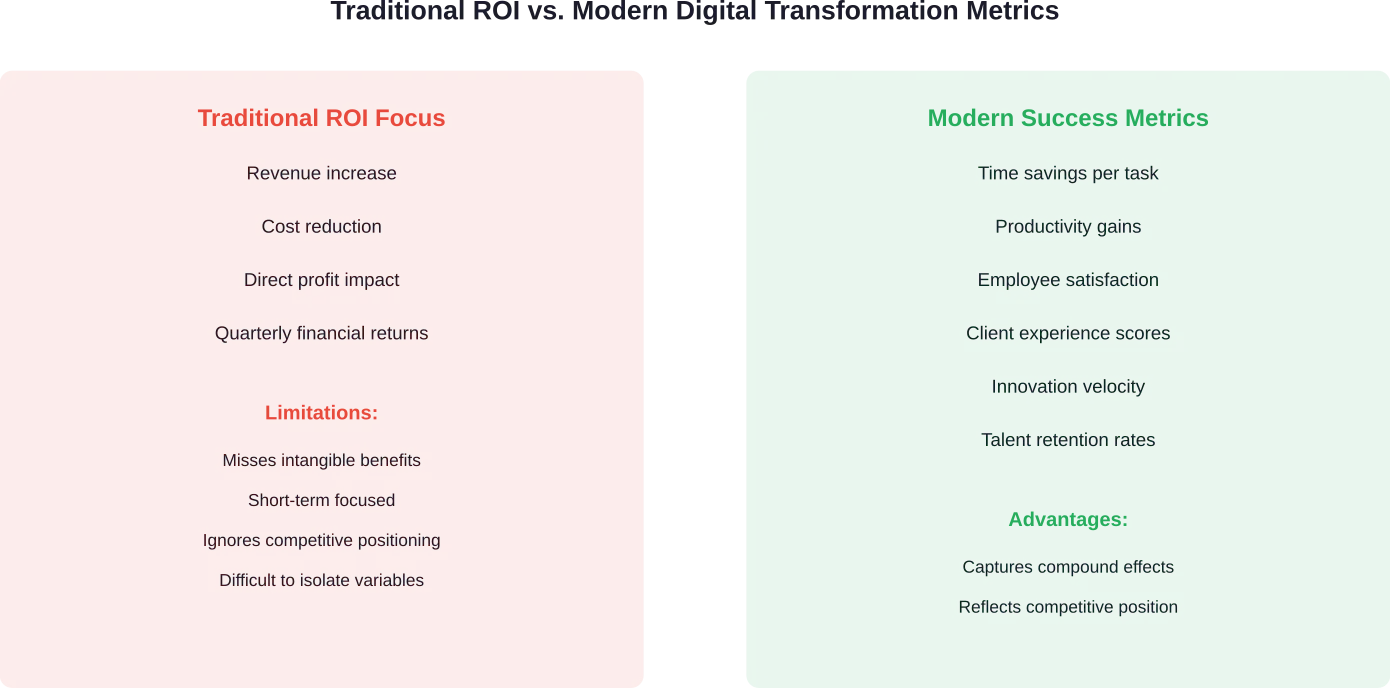
Measuring Digital Transformation Success
What gets measured gets managed. Tracking the right metrics determines whether transformation initiatives deliver promised value.
Operational Metrics
First-time fix rate measures the percentage of service calls resolved during the initial visit. Higher rates indicate better-prepared technicians with access to necessary information and parts.
Average service duration tracks how long typical jobs take. Reductions suggest improved efficiency without necessarily compromising quality.
Technician utilization calculates billable hours as a percentage of total working time. Optimized scheduling and reduced administrative burdens increase this ratio.
Equipment uptime monitors asset availability. Predictive maintenance should increase this metric significantly by preventing unexpected failures.
Customer Experience Metrics
Customer satisfaction scores capture overall service experience quality. Multiple measurement points—post-service surveys, Net Promoter Score, online reviews—provide comprehensive feedback.
Service level agreement compliance tracks performance against contractual commitments. Digital systems improve visibility into these obligations and automate escalation when deadlines approach.
Response time measures how quickly organizations address service requests. Faster responses typically correlate with higher satisfaction.
Financial Metrics
Cost per service call reveals operational efficiency. Digital transformation should reduce this metric through optimized routing, improved first-time fix rates, and decreased administrative overhead.
Revenue per technician indicates workforce productivity. Better tools enable each technician to complete more jobs or handle more complex assignments.
Return on investment calculations compare transformation costs against measurable benefits: reduced labor expenses, fewer emergency repairs, higher customer retention rates.
Emerging Trends Shaping Field Service Digital Transformation
Field service technology continues evolving rapidly. Organizations planning long-term strategies should monitor these developing trends.
Generative AI Applications
GenAI adoption in field service has already reached 40% of organizations for analysis, reporting, technician assistance, and task automation. This percentage will likely increase substantially as capabilities mature and use cases expand.
Future applications might include automated work order generation from customer descriptions, intelligent parts recommendations based on equipment history, and real-time procedure adjustments based on field conditions.
Digital Twin Technology
Digital twin technology has been researched for resource and asset tracking applications in field service management contexts where virtual replicas mirror physical equipment.
Digital twins enable simulation and testing without disrupting actual operations. Organizations can model different maintenance strategies, predict equipment behavior under various conditions, and optimize performance remotely.
5G Network Deployment
Research on digital transformation in oil and gas operations explores 5G NR-U models for multi-services digital private networks. These high-speed, low-latency connections enable real-time data transfer that wasn’t previously possible.
Field technicians can stream high-definition video for remote assistance without connectivity issues. IoT sensors transmit continuous data streams. Augmented reality applications respond instantly to user movements.
Advanced Automation
Workflow automation already handles routine tasks: appointment confirmations, parts ordering, invoice generation. Future automation will tackle increasingly complex processes.
Intelligent systems might autonomously reschedule appointments when emergencies arise, automatically dispatch the nearest qualified technician for urgent calls, or preemptively order replacement parts when sensors detect degrading equipment performance.
Common Pitfalls to Avoid
Organizations frequently make predictable mistakes during digital transformation initiatives. Awareness helps avoid these traps.
Technology Without Strategy
Implementing technology for its own sake rarely delivers value. Every digital initiative should connect clearly to specific business objectives and operational improvements.
The latest AI platform won’t help if core processes remain fundamentally broken. Fix process problems first, then apply technology to optimize effective workflows.
Underestimating Change Management
Brilliant technology implementations fail when people refuse to use them. Change management deserves equal attention to technical deployment.
Resistance often stems from legitimate concerns: fear of job loss, uncertainty about new responsibilities, frustration with poorly designed interfaces. Address these issues directly rather than dismissing them as obstinance.
Integration Neglect
Best-of-breed systems create value only when they communicate effectively. Data silos eliminate the visibility advantages that justify digital transformation investments.
Evaluate integration capabilities during vendor selection, not after purchase. API availability, data format compatibility, and update frequencies all affect how well systems work together.
Inadequate Training
Complex systems require proper training. Quick overview sessions don’t prepare users for real-world scenarios they’ll encounter.
Provide hands-on practice in safe environments. Create reference materials for common tasks. Establish support channels for questions that arise after initial training.
Frequently Asked Questions
- What is the typical ROI timeline for field service digital transformation?
ROI timelines vary significantly based on organization size, technology scope, and current state maturity. Generally speaking, organizations see initial returns within 6-12 months through efficiency gains and reduced operational costs. Full ROI often requires 18-36 months as systems mature and process optimizations compound. Research shows productivity can increase by 25% and breakdowns can decrease by 70% through predictive maintenance, but realizing these benefits takes time.
- How much does field service management software typically cost?
Pricing varies widely based on features, user count, and deployment model. Solutions range from basic scheduling tools to comprehensive platforms integrating IoT, AI, and mobile capabilities. Check vendor websites for current pricing as subscription models and feature tiers change frequently. Most vendors offer tiered plans scaled to organization size and complexity.
- Can small field service businesses benefit from digital transformation?
Absolutely. While small businesses may not need enterprise-scale solutions, they benefit tremendously from mobile work order management, automated scheduling, and customer communication tools. Many vendors offer solutions specifically designed for smaller operations with lower price points and simplified feature sets. Even basic digital tools eliminate paperwork, reduce scheduling errors, and improve customer communication.
- What skills do field technicians need for digital transformation success?
Basic digital literacy matters most: comfort using tablets or smartphones, ability to navigate applications, willingness to learn new tools. Most modern field service software emphasizes intuitive interfaces requiring minimal technical expertise. Organizations should provide adequate training and ongoing support rather than expecting technicians to figure out complex systems independently. Technical troubleshooting skills become more valuable as IoT and connected equipment proliferate.
- How does digital transformation improve customer satisfaction in field service?
Digital tools deliver several customer experience improvements. Real-time technician tracking provides accurate arrival windows. Automated notifications keep customers informed throughout service journeys. Self-service portals enable appointment scheduling without phone calls. Mobile-equipped technicians access complete service histories, improving first-time fix rates. According to research, enhanced customer experiences drive nearly half of all digital transformation initiatives because satisfaction directly impacts retention and revenue.
- What security concerns should organizations address during field service digital transformation?
Field service systems contain sensitive customer data, proprietary equipment information, and competitive intelligence requiring protection. According to NIST guidelines, proper authentication and access controls form the foundation of digital security. Organizations should implement encrypted data transmission, role-based access permissions, regular security audits, and employee training on phishing and social engineering threats. Mobile devices need remote wipe capabilities for lost or stolen equipment. Cloud vendors should demonstrate compliance with relevant security standards and regulations.
- How do IoT sensors integrate with existing field service operations?
IoT sensors monitor equipment performance, transmitting data to cloud platforms that analyze patterns and identify potential issues. When sensors detect anomalies—unusual temperatures, vibrations, or performance degradation—they trigger alerts in field service management systems. These alerts automatically generate work orders, schedule preventive maintenance, or notify customers of potential problems. The integration shifts operations from reactive repairs to proactive maintenance, reducing emergency calls and extending equipment lifespan. Implementation requires sensor installation, network connectivity, and platform integration but delivers substantial long-term value.
Conclusion
Digital transformation fundamentally changes how field service organizations operate, compete, and deliver value. The technologies enabling this transformation—mobile applications, IoT sensors, AI analytics, cloud platforms—work together to create visibility, efficiency, and customer experiences impossible with traditional approaches.
Research demonstrates concrete benefits: 25% productivity increases, 70% reductions in equipment breakdowns, improved customer satisfaction driving nearly half of transformation initiatives. These aren’t theoretical advantages. Organizations implementing digital strategies report measurable improvements across operational and financial metrics.
But technology alone doesn’t guarantee success. Strategic planning, change management, data governance, and continuous improvement distinguish transformations that deliver lasting value from implementations that disappoint.
The field service landscape continues evolving. GenAI adoption expands, digital twin technology matures, 5G networks enable new capabilities. Organizations that embrace transformation position themselves to adapt as technologies advance.
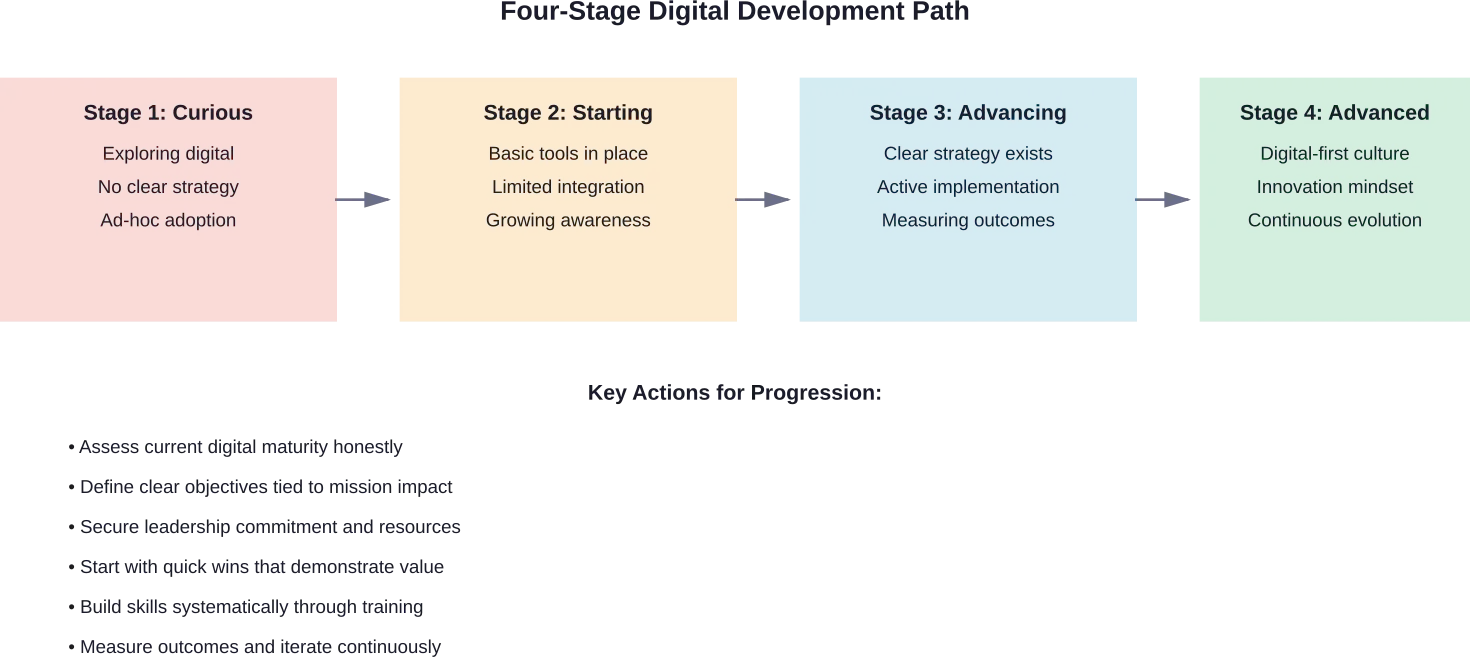
Start by assessing current operations honestly. Identify the biggest pain points and highest-value opportunities. Build a technology stack aligned with specific needs rather than chasing every trend. Involve frontline staff throughout the journey. Measure results consistently and optimize continuously.
Digital transformation isn’t optional anymore—it’s fundamental to remaining competitive in modern field service markets. The question isn’t whether to transform, but how quickly and effectively organizations can execute the transition.