Kurze Zusammenfassung: Die digitale Transformation im B2C-Bereich ermöglicht es Unternehmen, das Kundenerlebnis durch Technologieeinsatz, datengesteuerte Personalisierung und Omnichannel-Engagement zu modernisieren. Unternehmen, die sich diesen Veränderungen stellen, verbessern die Kundenzufriedenheit, die betriebliche Effizienz und die Wettbewerbsposition. Der Erfolg erfordert eine strategische Planung, ein kundenorientiertes Design und eine kontinuierliche Anpassung an die sich wandelnden Kundenerwartungen in einem zunehmend digitalen Markt.
Die Business-to-Consumer-Landschaft ist nicht mehr das, was sie vor fünf Jahren war. Die Erwartungen der Verbraucher haben sich dramatisch verändert. Sie fordern nahtlose digitale Erlebnisse, die den Komfort und die Personalisierung widerspiegeln, an die sie sich im täglichen Leben gewöhnt haben.
Die digitale Transformation für B2C-Unternehmen bedeutet mehr als nur die Erstellung einer Website oder die Einführung einer App. Es geht um ein grundlegendes Überdenken der Art und Weise, wie Unternehmen mit ihren Kunden über alle Berührungspunkte hinweg in Kontakt treten - von der ersten Kontaktaufnahme bis hin zur Unterstützung nach dem Kauf.
Und jetzt kommt's: Unternehmen, die diesen Wandel hinauszögern, riskieren, an Bedeutung zu verlieren, da die Konkurrenz stärkere digitale Fähigkeiten aufbaut. Die Kluft zwischen digitalen Marktführern und Nachzüglern wird jedes Jahr größer.
Digitale Transformation im B2C-Bereich verstehen
Die digitale Transformation im B2C-Kontext beinhaltet die Integration digitaler Technologien in alle Bereiche der verbrauchernahen Abläufe. Dies verändert die Art und Weise, wie Unternehmen Werte schaffen und mit Kunden interagieren, grundlegend.
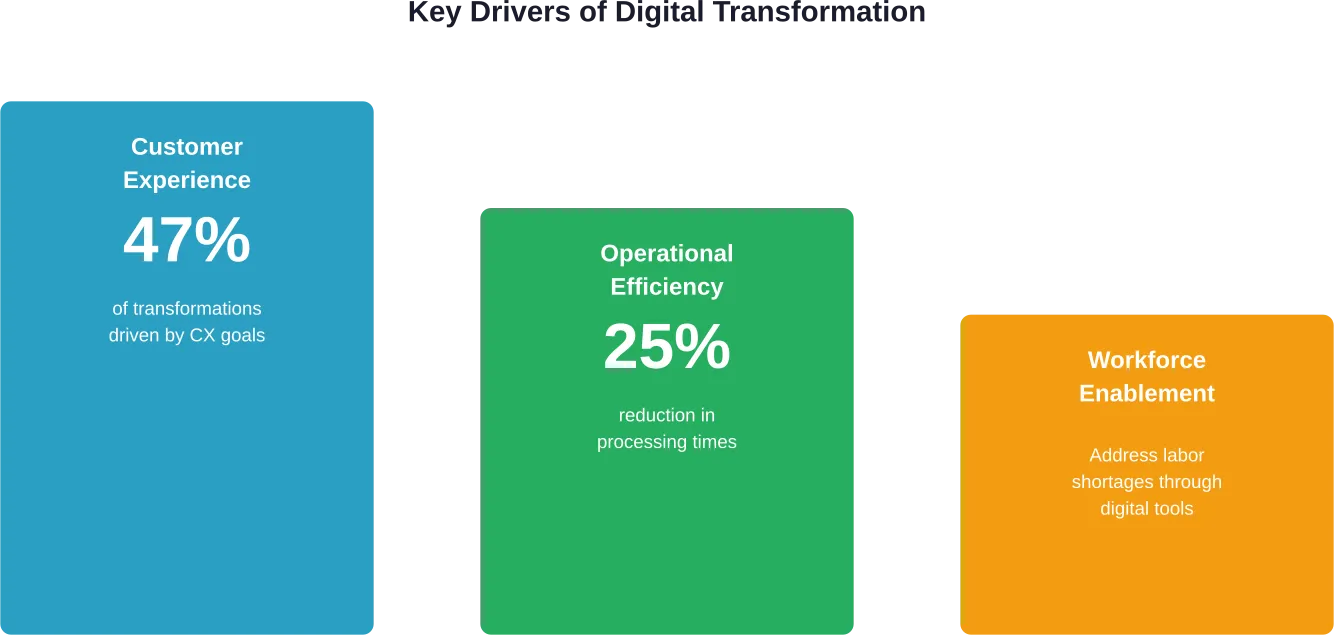
Laut einer Studie der Columbia Business School zum Thema Customer Experience Design stellt die Entwicklung vom traditionellen Marketing, das sich auf funktionale Produktaspekte konzentriert, hin zu einem umfassenden Customer Experience Design (CX) eine bedeutende strategische Veränderung dar. Das Produktmanagement, das sich früher ausschließlich auf Funktionen konzentrierte, priorisiert nun erfahrungsbasierte Ansätze.
Der Wandel geht über die Interaktion mit dem Kunden an der Front hinaus. Er berührt die Abläufe, die Lieferketten, das Datenmanagement und die Unternehmenskultur. Die Unternehmen müssen ihr gesamtes Geschäftsmodell anpassen, um den Anforderungen der digital aufgewachsenen Kunden gerecht zu werden, die sofortigen Zugang, Personalisierung und nahtlose Omnichannel-Erlebnisse erwarten.
Warum sich die B2C-Transformation von der B2B-Transformation unterscheidet
Die Umwandlung von Geschäften zwischen Unternehmen und Verbrauchern ist mit anderen Herausforderungen verbunden als im B2B-Kontext. Bei Verbrauchertransaktionen geht es in der Regel um geringere Einzelwerte, aber um weitaus größere Mengen. Der Kaufzyklus ist kürzer, oft impulsiv und wird stark von emotionalen Faktoren und weniger von rationalen Bewertungen beeinflusst.
B2C-Kunden erwarten sofortige Befriedigung. Sie tolerieren keine komplexe Navigation, langsame Ladezeiten oder fragmentierte Erlebnisse auf verschiedenen Geräten. Die Messlatte wird von den Branchenführern gesetzt - jedes B2C-Unternehmen konkurriert mit den nahtlosen Erlebnissen, die die großen Plattformen bieten, unabhängig von der Branche.
Daten von Forrester zeigen, dass nur 25% der Datenschutz-Entscheidungsträger von einer Zusammenarbeit zwischen dem Datenschutzteam ihres Unternehmens und den Marketingabteilungen berichten. Dies stellt ein erhebliches Risiko für B2C-Unternehmen dar, bei denen das Marketing von Natur aus kundenorientiert und datenintensiv ist.
Digitale Transformation für B2C-Geschäfte
B2C-Unternehmen benötigen schnelle, skalierbare und sichere Systeme, um ihre Kunden effektiv bedienen zu können. A-listware hilft bei der Implementierung moderner Plattformen und bietet langfristigen technischen Support.
Kernbereiche:
- elektronischer Handel und mobile Anwendungen
- Tools für Kundenbindung und CRM
- Datenanalytik und Personalisierung
- sichere Cloud-Infrastruktur
Das Team kann Ihr Personal verstärken oder ganze Projekte leiten. Beginnen Sie Ihre B2C-Transformation mit A-listware heute.
Schlüsselfaktoren, die den B2C-Handel umgestalten
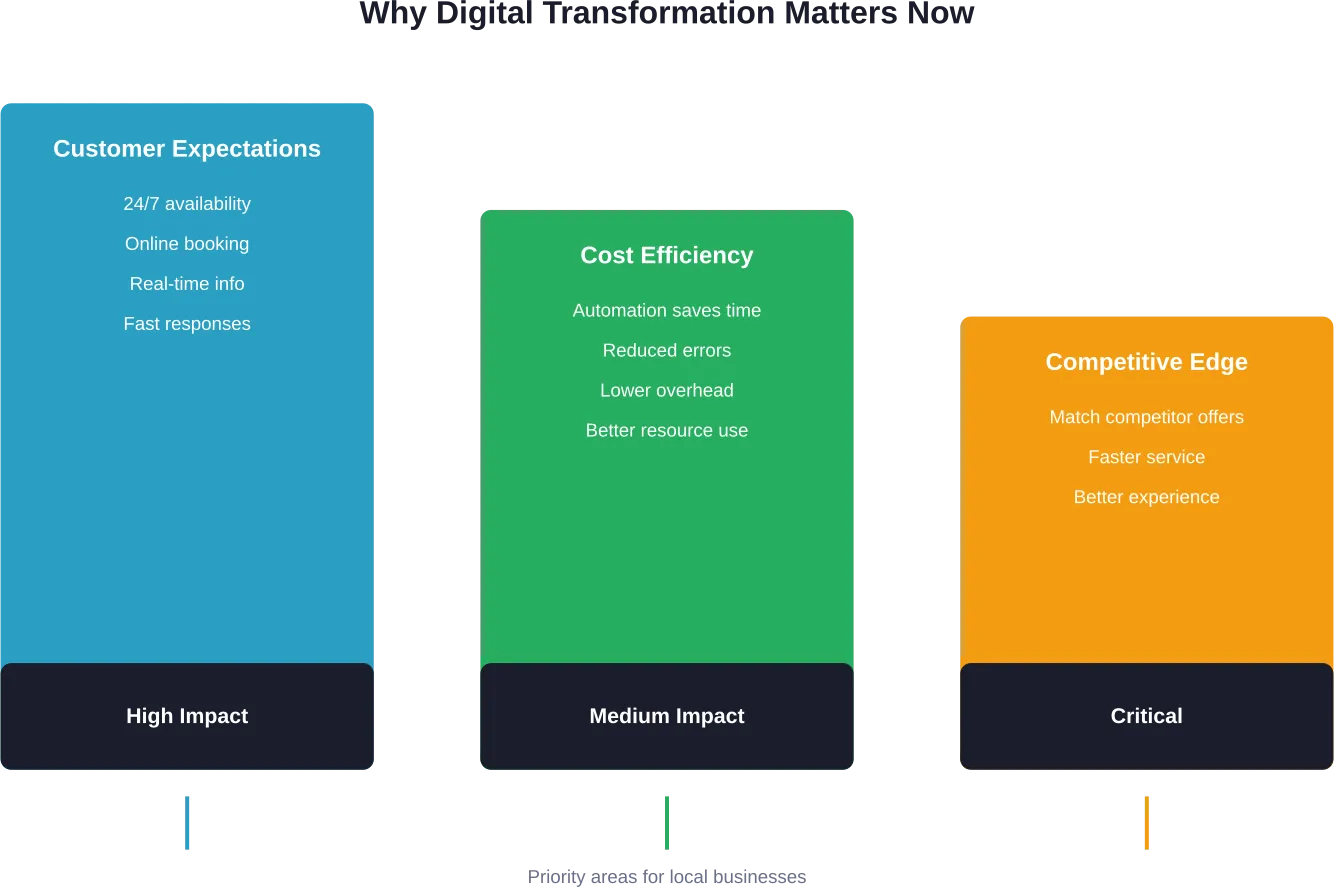
Mehrere Kräfte beschleunigen die digitale Transformation in den Verbrauchermärkten. Das Verständnis dieser Faktoren hilft bei der Priorisierung von Transformationsinitiativen und der effektiven Zuweisung von Ressourcen.
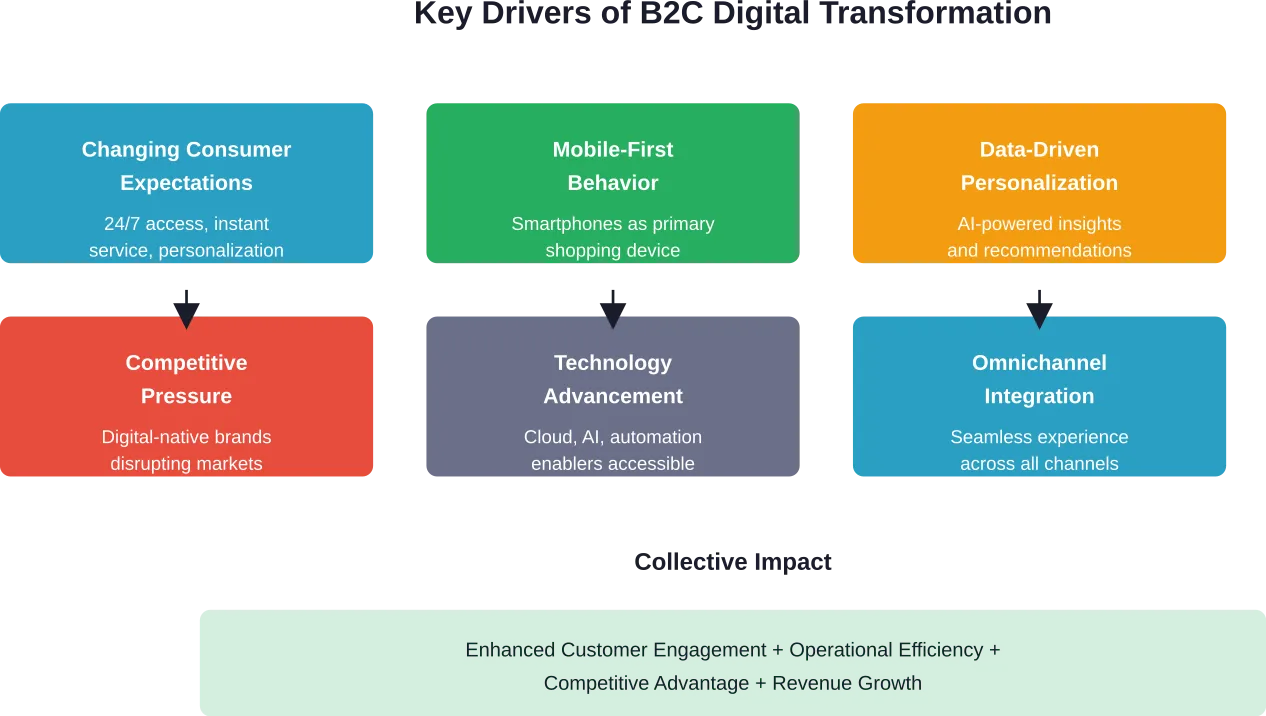
Verbrauchererwartungen steigen weiter an
Verbraucher erwarten heute von Marken, dass sie ihre Vorlieben kennen, ihre Bedürfnisse vorhersehen und konsistente Erfahrungen bieten, egal ob sie über eine mobile App, eine Website, soziale Medien oder ein Geschäft einkaufen. Diese Erwartung geht über die eigentliche Transaktion hinaus und umfasst auch den Kundenservice, die Rückgabe und die laufende Betreuung.
Die Dartmouth-Studie über digitale Kunden zeigt, wie digitale Technologien das Machtgleichgewicht zugunsten der Verbraucher grundlegend verändert haben. Sie nutzen digitale Tools, um Informationen zu sammeln und Kaufoptionen zu bewerten, und verlangen von den Unternehmen, dass sie mit verbesserten Kundenerlebnissen, wettbewerbsfähigen Preisen und einer stärkeren Ausrichtung an den Kundenwerten reagieren.
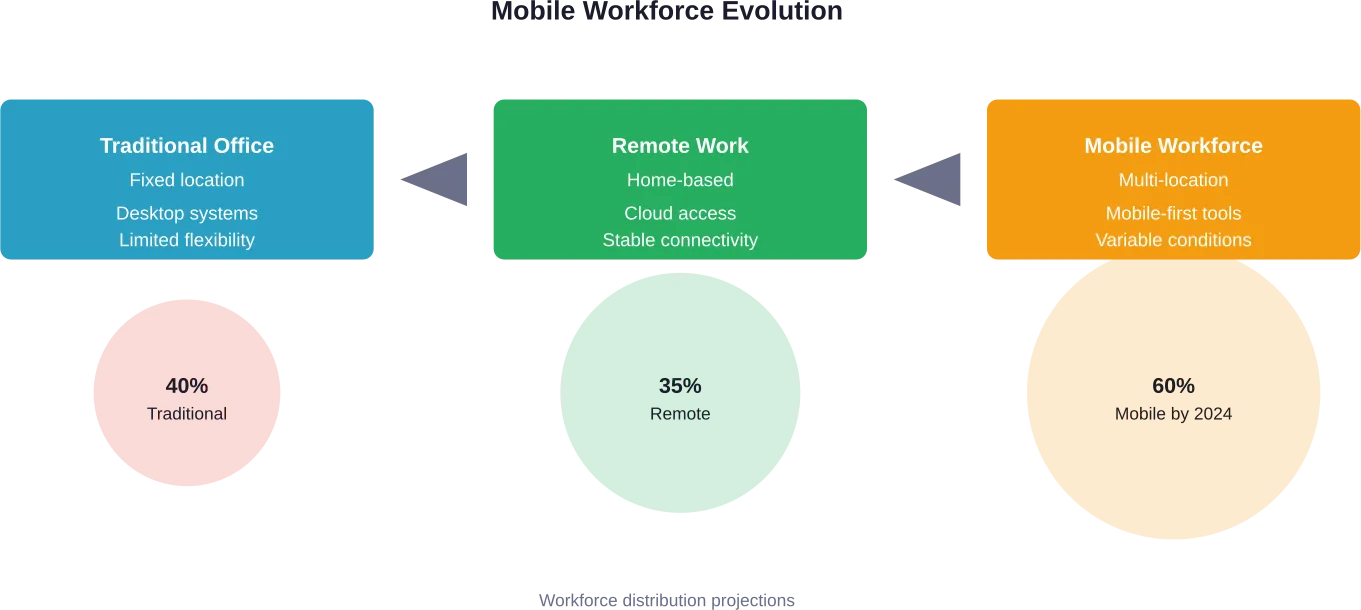
Mobile als primärer Kanal
Das Smartphone ist zum zentralen Gerät für Verbraucherinteraktionen geworden. Unternehmen müssen jeden digitalen Touchpoint für mobile Erlebnisse optimieren, und zwar nicht als nachträgliche Überlegung, sondern als primäre Designüberlegung.
Beim Mobile-First-Design geht es nicht nur um responsive Layouts. Es umfasst auch Zahlungsoptionen, Navigationsmuster, Ladezeiten und die Formatierung von Inhalten, die berücksichtigt, wie Verbraucher ihre Geräte im Laufe des Tages tatsächlich nutzen.
Anforderungen an Daten und Personalisierung
Die Verbraucher erwarten zunehmend personalisierte Empfehlungen, gezielte Angebote und Inhalte, die ihre individuellen Vorlieben und ihre Kaufhistorie widerspiegeln. Dies erfordert eine ausgefeilte Datenerfassung, -analyse und -anwendung über alle Kundenkontaktpunkte hinweg.
Aber genau hier wird es kompliziert. Datenschutzbedenken und -vorschriften führen zu Spannungen zwischen Personalisierungswünschen und Datenschutzanforderungen. Forrester-Daten zeigen, dass nur 25% der Datenschutzteams effektiv mit den Marketingabteilungen zusammenarbeiten, was zu Lücken im verantwortungsvollen Umgang mit Kundendaten führt, während gleichzeitig personalisierte Erlebnisse geboten werden.
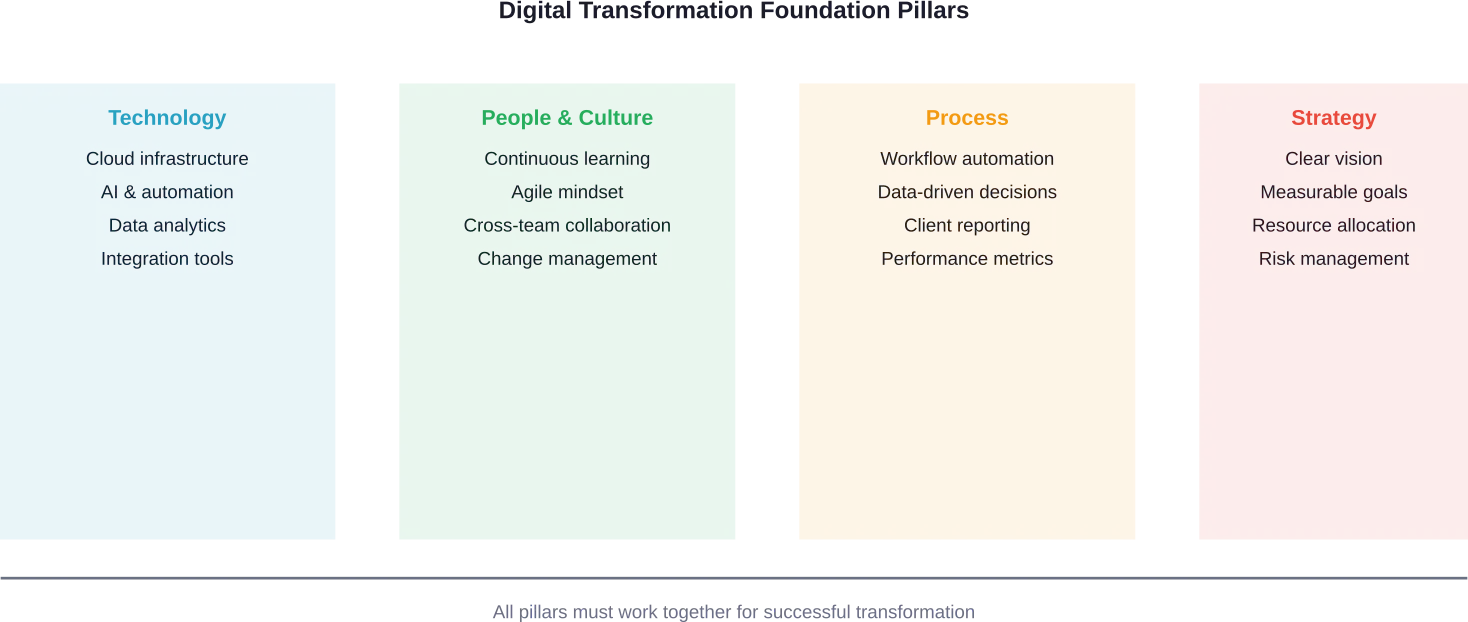
Kernkomponenten der digitalen B2C-Transformation
Erfolgreiche Transformationsinitiativen weisen mehrere gemeinsame Elemente auf. Diese Komponenten wirken zusammen, um kohärente digitale Erlebnisse zu schaffen, die Geschäftsergebnisse fördern.
| Komponente | Beschreibung | Auswirkungen auf die Wirtschaft |
|---|---|---|
| Plattform für Kundendaten | Einheitliche Kundenprofile über alle Kontaktpunkte hinweg | Ermöglicht Personalisierung und konsistente Erfahrungen |
| Omnichannel-Handel | Nahtloses Einkaufen im Internet, auf dem Handy, in sozialen Netzwerken und vor Ort | Steigert die Konversionsraten und die Kundenzufriedenheit |
| Marketing-Automatisierung | Ausgelöste Kommunikation auf der Grundlage von Verhalten | Verbessert das Engagement und reduziert den manuellen Aufwand |
| KI und Analytik | Prädiktive Erkenntnisse und Empfehlungen | Optimiert den Bestand, die Preisgestaltung und die Kundenansprache |
| Digitaler Zahlungsverkehr | Mehrere Zahlungsoptionen einschließlich digitaler Geldbörsen | Reduziert Reibungsverluste und abgebrochene Transaktionen |
| Technischer Kundendienst | Chatbots, Selbstbedienungsportale, KI-gestützte Unterstützung | Senkung der Kosten bei gleichzeitiger Verbesserung der Reaktionszeiten |
Erfahrungsbasierter Ansatz vor Fähigkeiten
Die Forschungen der Columbia Business School zum Design von Kundenerlebnissen zeigen einen entscheidenden Strategiewechsel auf. In einer Fallstudie der Columbia Business School wurde beschrieben, wie ein Unternehmen mit geringer Markenbekanntheit und einem komplizierten Produkt mit einem Budget von nicht mehr als $300.000 von einem fähigkeitsbasierten Ansatz zu einem erlebnisbasierten Ansatz wechselte.
Dieses erlebnisorientierte Design ermöglichte eine deutliche Verbesserung der Kundenbindung. Die Lektion? Die digitale Transformation erfordert nicht unbedingt große Budgets, sondern strategisches Denken darüber, wie man Erlebnisse gestaltet, die bei den Kunden ankommen.
Aufbau kollaborativer Ökosysteme
Die Forschung der MIT Sloan Management Review zu kollaborativen Ökosystemen unterstreicht, dass die Transformation zunehmend Partnerschaften über die gesamte Wertschöpfungskette hinweg erfordert. B2C-Unternehmen können nicht alles selbst entwickeln.
Strategische Partnerschaften mit Technologieanbietern, Logistikunternehmen, Zahlungsabwicklern und Datenanalysefirmen ermöglichen eine schnellere Umstellung und den Zugang zu spezialisierten Fähigkeiten, ohne den Aufwand, eigene Lösungen für jeden Bedarf zu entwickeln.
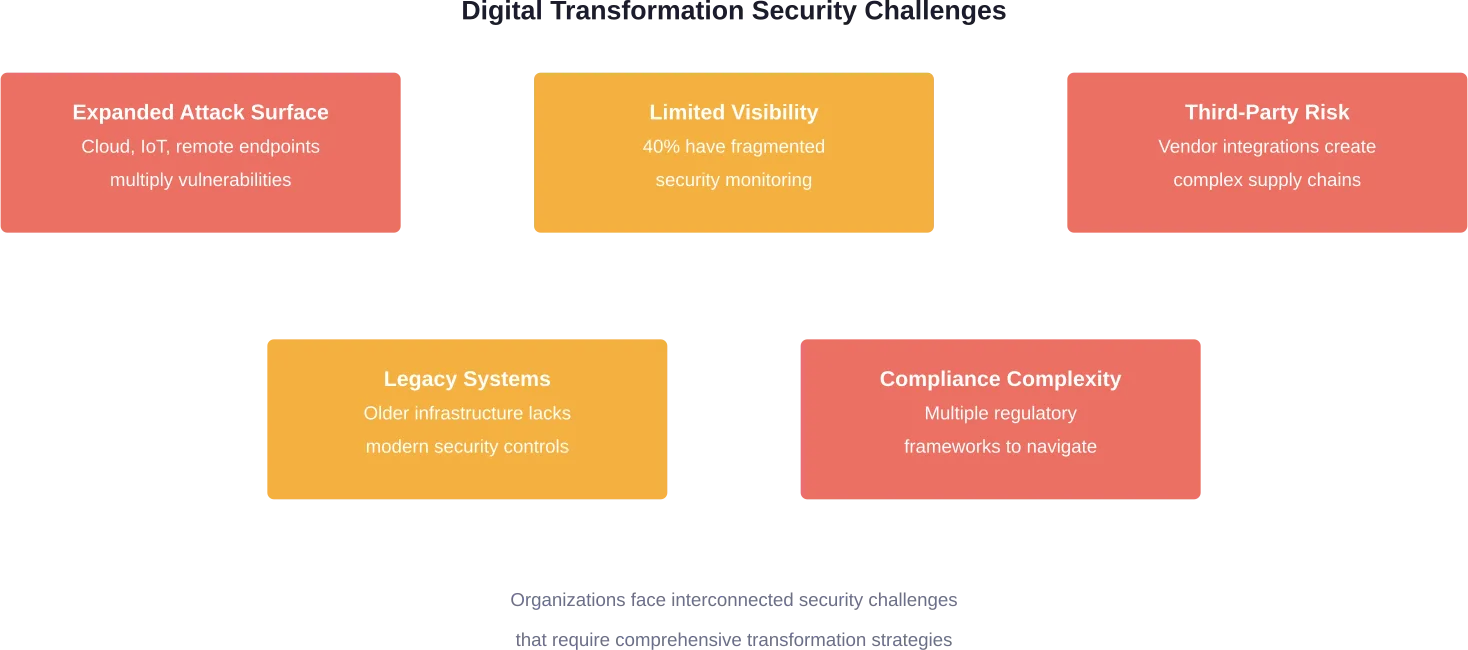
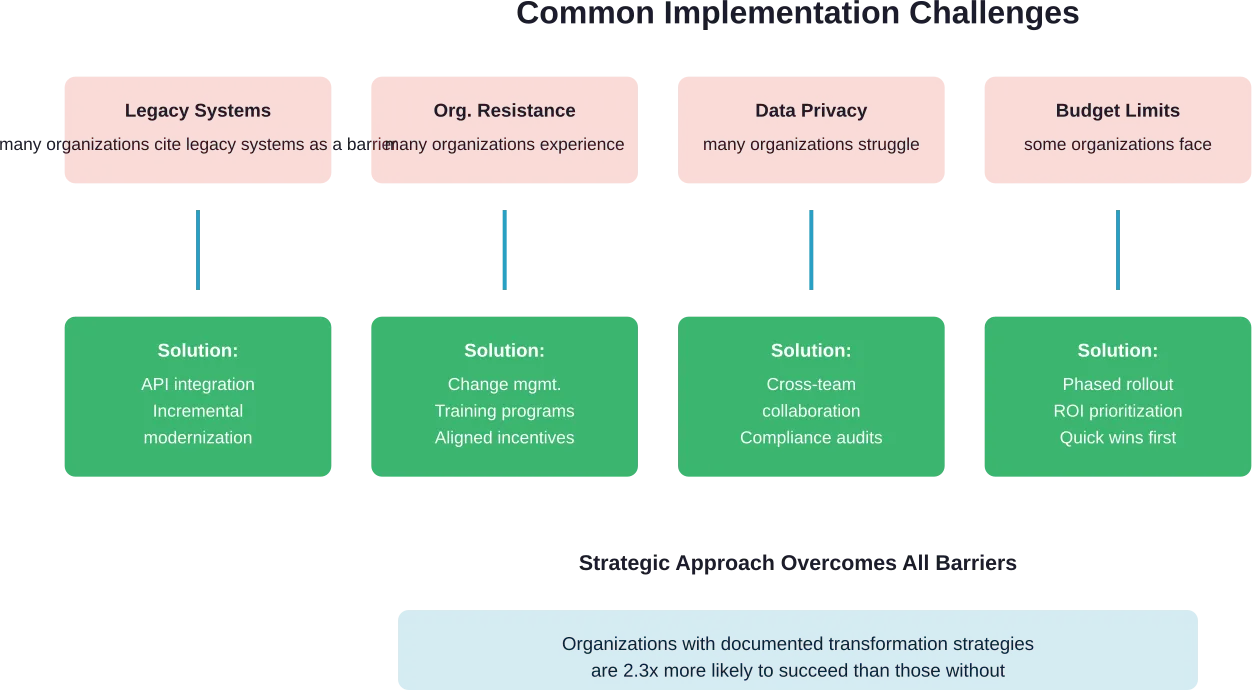
Herausforderungen und Lösungen bei der Umsetzung
Die digitale Transformation ist kein gerader Weg. Unternehmen stoßen auf vorhersehbare Hindernisse, die Initiativen zum Scheitern bringen oder den Zeitplan erheblich verlängern können.
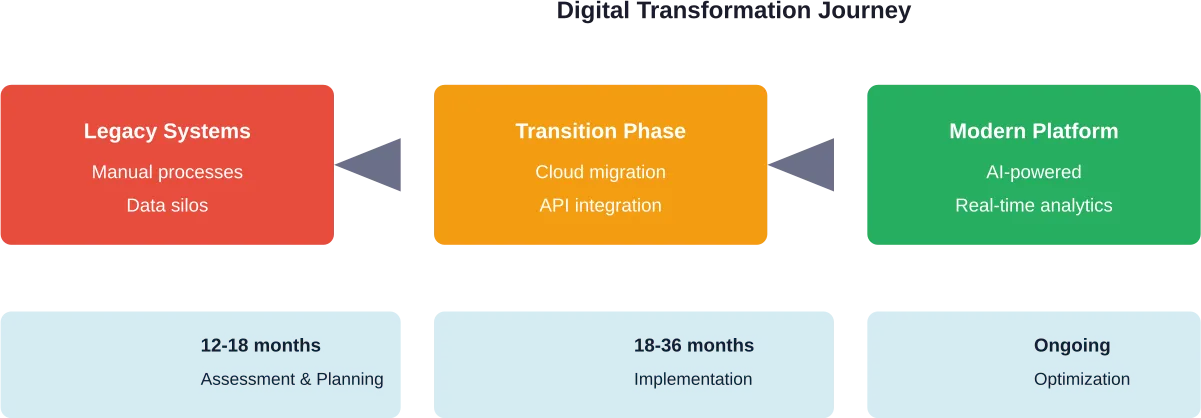
Integration von Altsystemen
Viele B2C-Unternehmen arbeiten mit einer veralteten technologischen Infrastruktur, die nicht für moderne digitale Erlebnisse konzipiert wurde. Diese Altsysteme lassen sich oft nicht problemlos in neue digitale Plattformen integrieren, was zu Datensilos und betrieblichen Ineffizienzen führt.
Die Lösung besteht eher in einer schrittweisen Modernisierung als in einem umfassenden Austausch. API-Schichten können alte und neue Systeme miteinander verbinden, während Funktionen schrittweise auf moderne Plattformen migriert werden. Dieser Ansatz verringert das Risiko und erhält die Geschäftskontinuität während der Transformation aufrecht.
Organisatorischer Widerstand
Die digitale Transformation erfordert einen kulturellen Wandel, nicht nur die Implementierung von Technologien. Mitarbeiter, die an traditionelle Prozesse gewöhnt sind, sträuben sich möglicherweise gegen neue Arbeitsabläufe, Tools und Leistungskennzahlen.
Erfolgreiche Unternehmen investieren von Beginn des Projekts an in das Veränderungsmanagement. Dazu gehören eine klare Kommunikation über die Transformationsziele, Schulungsprogramme zum Aufbau digitaler Kompetenzen und Anreizstrukturen, die auf die neuen Arbeitsweisen abgestimmt sind.
Datenschutz und Compliance
Vorschriften wie der INFORM Consumers Act der FTC und der CAN-SPAM Act legen fest, wie B2C-Unternehmen Kundendaten erfassen, speichern und verwenden. Die Nichteinhaltung dieser Vorschriften wird mit erheblichen Strafen geahndet.
Laut FTC-Leitfaden gilt der CAN-SPAM Act für alle kommerziellen Nachrichten (einschließlich E-Mails), deren Hauptzweck kommerzielle Werbung oder Verkaufsförderung ist, und nicht nur für Massen-E-Mails. Unternehmen müssen eindeutige Opt-out-Mechanismen bereitstellen und Aufforderungen zur Abmeldung umgehend nachkommen.
Für Online-Verkäufer mit hohem Umsatz verlangt das INFORM-Verbrauchergesetz, dass Online-Marktplätze die Verkäuferinformationen überprüfen und bestimmte Angaben öffentlich zugänglich machen. Dies wirkt sich auf B2C-Unternehmen aus, die über Plattformen Dritter verkaufen.
Qualifikationsdefizite und Talentmangel
Die digitale Transformation erfordert Fähigkeiten, die vielen traditionellen B2C-Unternehmen intern fehlen. Data Science, UX-Design, Cloud-Architektur und digitale Marketing-Automatisierung erfordern allesamt spezielle Fähigkeiten.
Die Unternehmen gehen dieses Problem durch eine Kombination aus Neueinstellungen, Schulungen für vorhandene Mitarbeiter und Partnerschaften mit spezialisierten Agenturen oder Beratern an. Einige nutzen auch Offshore-Entwicklungs- und Support-Teams, um auf globale Talentpools zu unterschiedlichen Kostenstrukturen zuzugreifen.
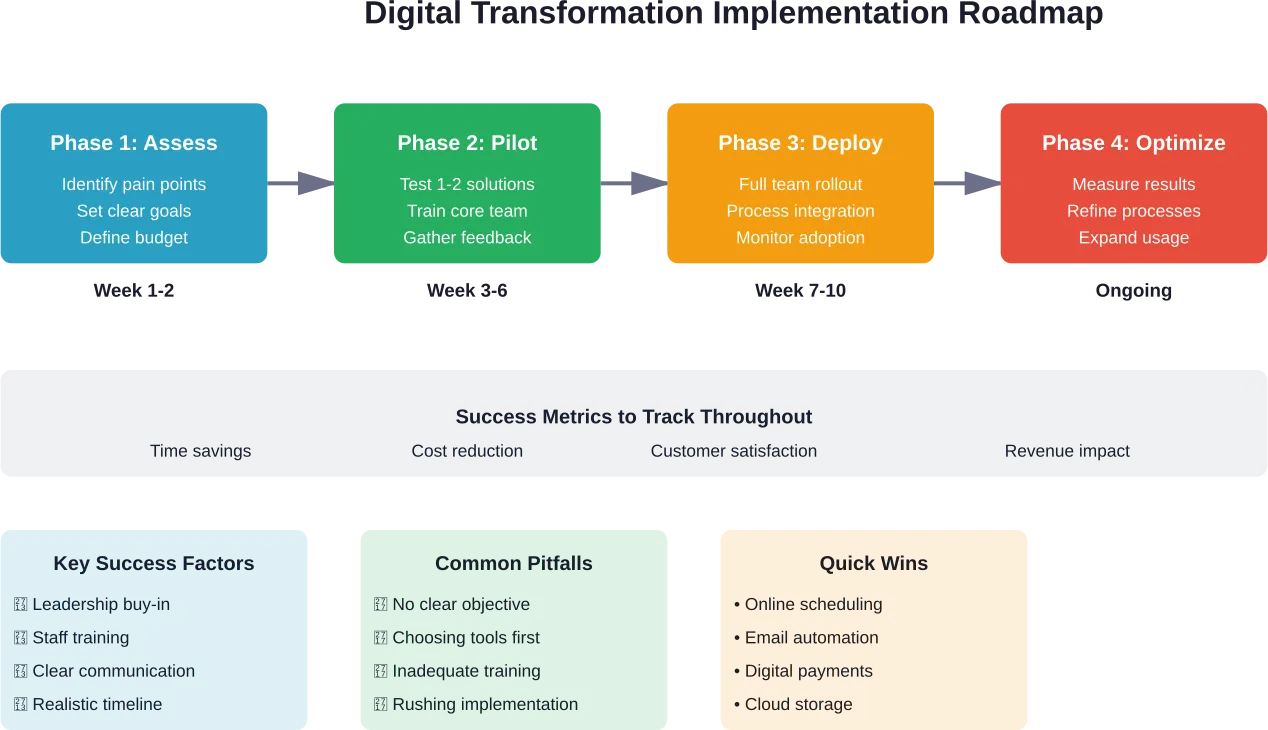
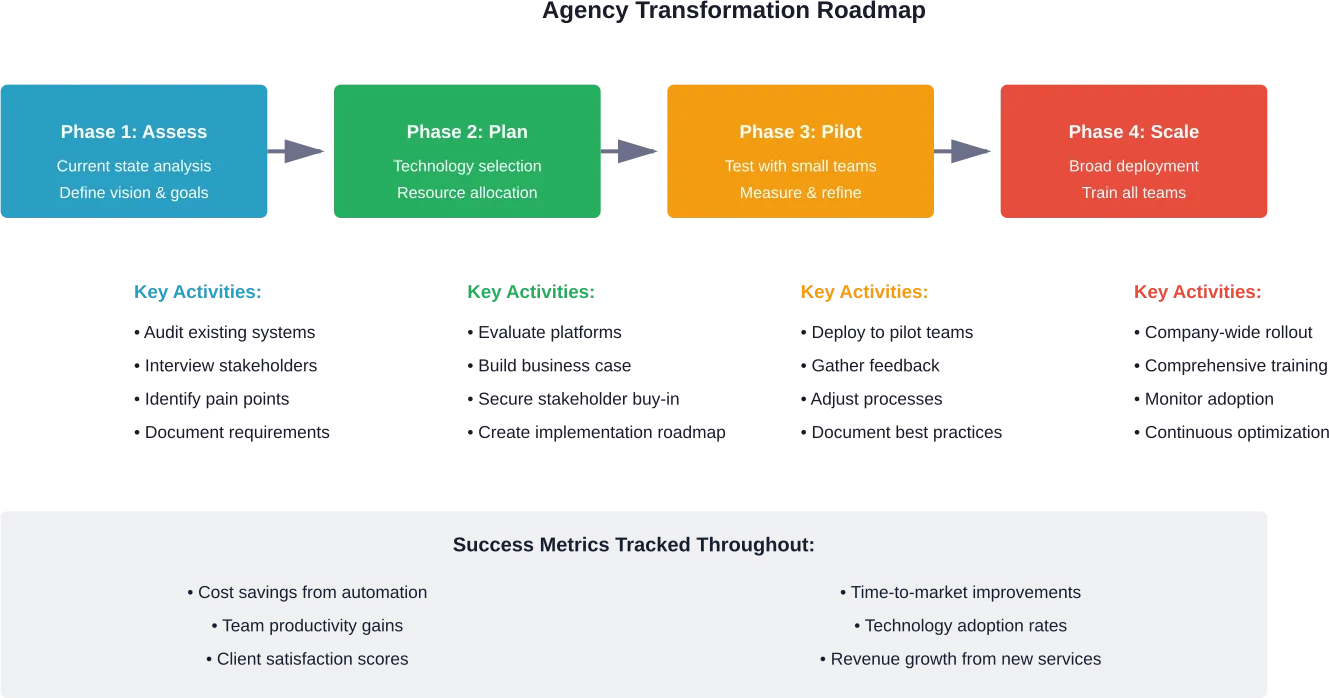
Strategien für eine erfolgreiche B2C-Transformation
Unternehmen, die die Transformation erfolgreich meistern, folgen Mustern, die das Risiko minimieren und gleichzeitig die Auswirkungen auf das Geschäft maximieren.
Beginnen Sie mit Customer Journey Mapping
Bevor Sie eine neue Technologie implementieren, sollten Sie die aktuellen Kundenerfahrungen an allen Berührungspunkten erfassen. Identifizieren Sie Schmerzpunkte, Reibungspunkte und Verbesserungsmöglichkeiten.
Dieser kundenorientierte Ansatz stellt sicher, dass die Umgestaltungsbemühungen echte Probleme angehen und nicht Technologie um der Technologie willen implementiert wird. Er hilft auch dabei, Initiativen auf der Grundlage der Auswirkungen auf die Kunden zu priorisieren und nicht nach internen Präferenzen.
Einen agilen, iterativen Ansatz wählen
Das traditionelle Wasserfall-Projektmanagement eignet sich nicht gut für die digitale Transformation. Anforderungen ändern sich, Technologien entwickeln sich weiter, und Kundenerwartungen ändern sich während mehrjähriger Initiativen.
Agile Methoden ermöglichen es Unternehmen, schrittweise Werte zu schaffen, aus jeder Version zu lernen und die Prioritäten auf der Grundlage der Ergebnisse anzupassen. Dies verringert das Risiko und erhält die Dynamik des Unternehmens aufrecht, selbst wenn bestimmte Initiativen nicht die erwarteten Ergebnisse liefern.
Messen, was wichtig ist
Definieren Sie vor dem Start von Transformationsinitiativen klare Erfolgskennzahlen. Diese sollten mit den Geschäftsergebnissen in Verbindung stehen - Customer Lifetime Value, Konversionsraten, durchschnittlicher Bestellwert, Kundenzufriedenheitswerte - und nicht mit Eitelkeitsmetriken wie Seitenaufrufen oder Social-Media-Anhängern.
Regelmäßige Messungen und Berichte sorgen dafür, dass Initiativen rechenschaftspflichtig sind, und liefern Frühwarnungen, wenn Anpassungen erforderlich sind. Übertreiben Sie es aber nicht mit den Messungen. Konzentrieren Sie sich auf die 5-7 Messgrößen, die wirklich zeigen, ob die Transformation funktioniert.
| Strategie-Element | Ansatz für die Umsetzung | Erfolgsindikator |
|---|---|---|
| Kundenorientiertes Design | Journey Mapping, Persona-Entwicklung, kontinuierliches Feedback | Verbesserte Zufriedenheitswerte, weniger Supportanfragen |
| Technologiestiftung | Cloud-Infrastruktur, API-zentrierte Architektur, skalierbare Plattformen | Systembetriebszeit, Integrationsgeschwindigkeit, Skalierbarkeitsmetriken |
| Datengestützte Entscheidungen | Implementierung von Analysen, A/B-Tests, Kundeneinblicke | Verbesserung der Konversionsrate, Wirksamkeit der Personalisierung |
| Organisatorische Ausrichtung | Funktionsübergreifende Teams, klare Führung, Unterstützung durch die Geschäftsführung | Projektgeschwindigkeit, Mitarbeiterzufriedenheit, Adoptionsraten |
| Kontinuierliche Verbesserung | Regelmäßige Retrospektiven, Experimentierkultur, Lernschleifen | Innovationsrate, Markteinführungszeit für neue Funktionen |
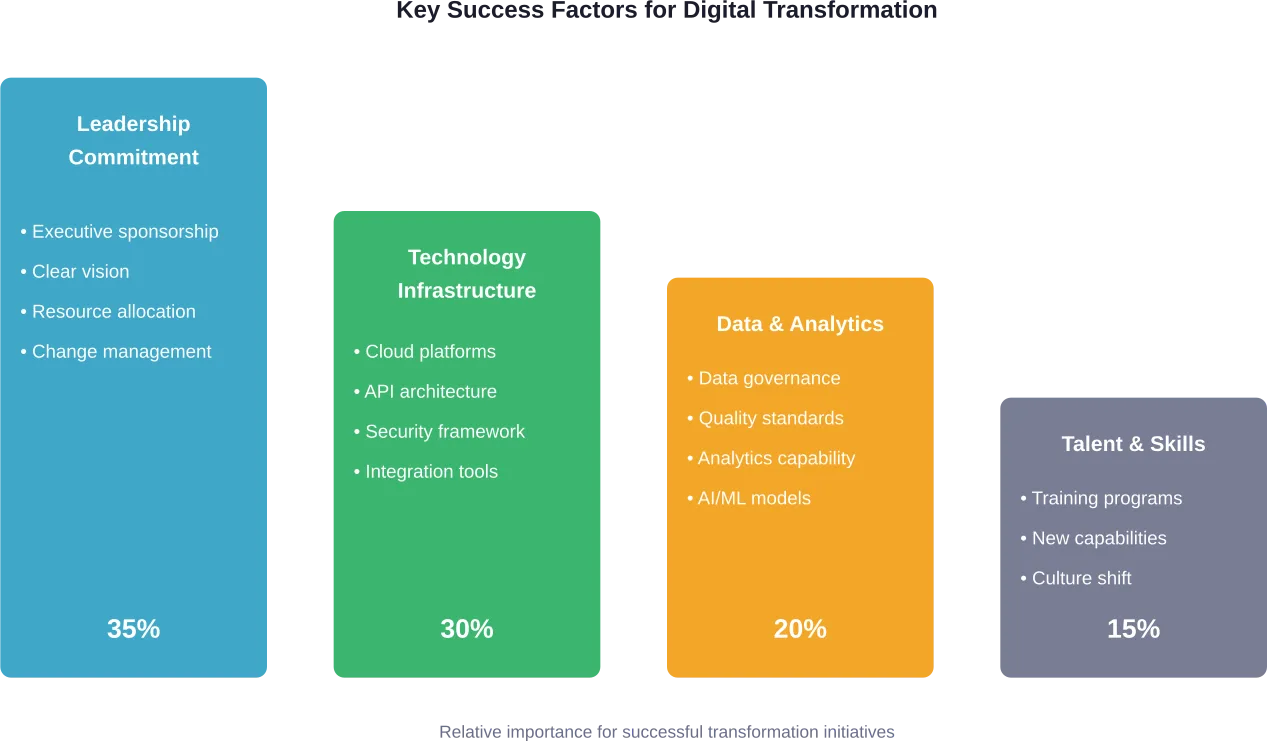
In Change Management investieren
Die Technologieimplementierung macht vielleicht 30% der Transformationsarbeit aus. Die restlichen 70% betreffen Menschen, Prozesse und Kultur.
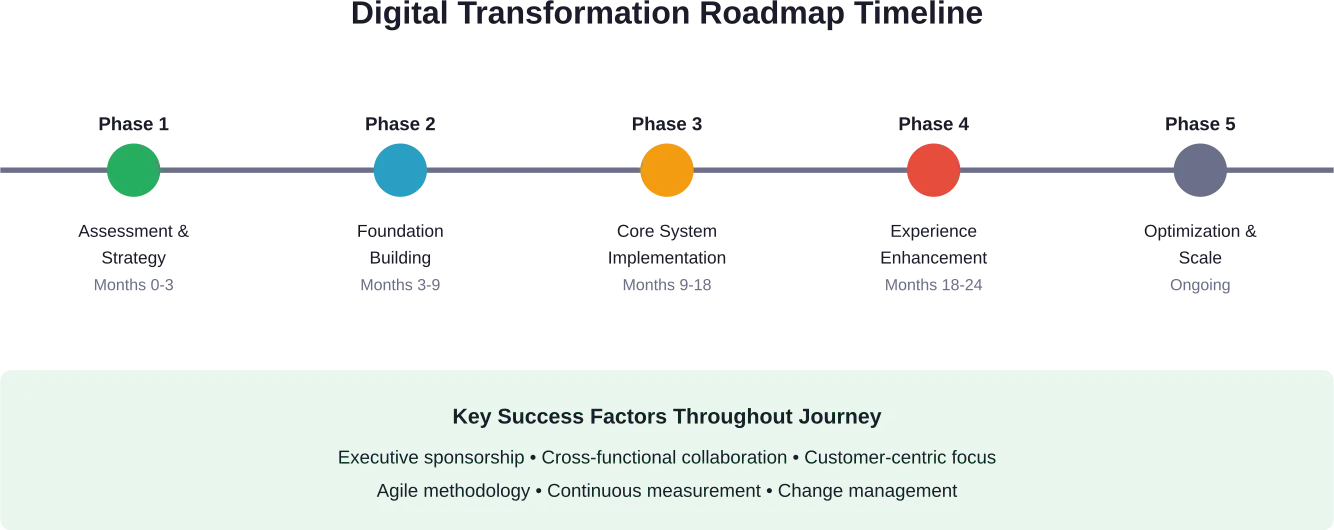
Das Veränderungsmanagement beginnt mit dem Sponsoring durch die Geschäftsleitung und zieht sich durch die gesamte Organisation. Eine klare Kommunikation darüber, warum der Wandel wichtig ist, wie er abläuft und was er für die verschiedenen Rollen bedeutet, hilft, Widerstände abzubauen und eine Dynamik aufzubauen.
Die Rolle des Marketings bei der B2C-Transformation
Das Marketing befindet sich an der Schnittstelle zwischen Kundenerfahrung und Unternehmenstechnologie und ist somit von zentraler Bedeutung für die Transformationsbemühungen.
Die Forrester-Studie zur Transformation des B2C-Marketings unterstreicht, dass Marketingverantwortliche mit KI-Störungen, Marktfragmentierung und neuen Herausforderungen bei der Messung umgehen müssen. Die Grundlagen des B2C-Marketings bleiben wichtig, aber die Ausführung erfordert neue Fähigkeiten und Ansätze.
Markenbildung in digitalen Kanälen
Der digitale Wandel macht starke Marken nicht überflüssig. Im Gegenteil: Mit der Zunahme digitaler Kanäle und der Fragmentierung der Aufmerksamkeit der Verbraucher werden unverwechselbare Marken sogar noch wertvoller.
B2C-Unternehmen müssen Wege finden, um Markenbewusstsein und -affinität über digitale Kanäle aufzubauen - Content Marketing, Engagement in sozialen Medien, Partnerschaften mit Influencern und Aufbau von Communities. Dies erfordert andere Fähigkeiten als traditionelle Markenwerbung, dient aber demselben grundlegenden Zweck.
Navigieren durch KI und Automatisierung
Generative KI schafft sowohl Chancen als auch Herausforderungen für B2C-Vermarkter. Sie ermöglicht die Erstellung von Inhalten in großem Umfang, personalisierte Kundeninteraktionen und anspruchsvolle prädiktive Analysen.
Aber es verändert auch die Art und Weise, wie Verbraucher Produkte entdecken. Das Suchverhalten entwickelt sich weiter, da KI-gestützte Tools direkte Antworten statt Linklisten liefern. B2C-Unternehmen müssen ihre digitale Präsenz anpassen, um in diesem veränderten Umfeld auffindbar zu bleiben.
Aufkommende Trends, die die digitale B2C-Zukunft prägen
Die digitale Transformation ist kein Ziel, sondern ein fortlaufender Anpassungsprozess, da sich Technologie und Verbraucherverhalten ständig weiterentwickeln.
Integration des sozialen Handels
Soziale Medienplattformen fungieren zunehmend als Handelskanäle, nicht nur als Marketingkanäle. Die Verbraucher entdecken Produkte, recherchieren Optionen, tätigen Käufe und teilen Bewertungen - alles in sozialen Umgebungen.
B2C-Unternehmen müssen Social Commerce in ihre breitere digitale Strategie integrieren, indem sie kaufbare Inhalte und nahtlose Checkout-Erlebnisse auf sozialen Plattformen schaffen und gleichzeitig ein konsistentes Branding über alle Kanäle hinweg beibehalten.
Voice und Conversational Commerce
Sprachassistenten und künstliche Intelligenz verändern die Art und Weise, wie Verbraucher mit Marken interagieren. Auch wenn die Akzeptanz langsamer ist, als die ersten Prognosen vermuten ließen, nehmen sprachgesteuertes Einkaufen und sprachgesteuerter Kundenservice weiter zu.
Unternehmen, die sich auf diesen Wandel vorbereiten, konzentrieren sich auf konversationelle Designprinzipien, natürliche Sprachverarbeitung und Optimierung der Sprachsuche für ihre digitalen Inhalte.
Nachhaltigkeit und Werteausrichtung
Die Dartmouth-Studie über digitale Kunden stellt fest, dass Unternehmen eine stärkere Ausrichtung auf die Werte ihrer Kunden nachweisen müssen. Die Verbraucher berücksichtigen bei ihren Kaufentscheidungen zunehmend Markenwerte und Nachhaltigkeitspraktiken.
Die digitale Transformation ermöglicht eine größere Transparenz über Lieferketten, Beschaffungspraktiken und Umweltauswirkungen. B2C-Unternehmen, die ihre Werte und Praktiken über digitale Kanäle effektiv kommunizieren, bauen stärkere Kundenbeziehungen auf.
Messung des Transformationserfolgs
Woher wissen Unternehmen, ob ihre Transformationsbemühungen erfolgreich sind? Klare, an die Geschäftsergebnisse gekoppelte Messgrößen geben die Antwort.
Metriken zur Kundenerfahrung
Net Promoter Score (NPS), Customer Satisfaction (CSAT) und Customer Effort Score (CES) messen alle verschiedene Aspekte der Erlebnisqualität. Verfolgen Sie diese konsequent vor und nach Transformationsinitiativen, um die Auswirkungen zu quantifizieren.
Digital-spezifische Metriken wie App-Bewertungen, Website-Benutzerfreundlichkeit und Abschlussraten der Customer Journey bieten zusätzliche Einblicke in die Leistung digitaler Touchpoints.
Leistungsindikatoren für Unternehmen
Die Umwandlung muss letztlich zu Geschäftsergebnissen führen. Verfolgen Sie Kennzahlen wie Konversionsraten, durchschnittlichen Bestellwert, Customer Lifetime Value und Kundenakquisitionskosten.
Vergleichen Sie diese Metriken über Kundensegmente, Kanäle und Zeiträume hinweg, um zu verstehen, wo die Transformation den größten Nutzen bringt und wo zusätzliche Arbeit erforderlich ist.
Operative Effizienzgewinne
Die digitale Transformation sollte auch die betriebliche Effizienz verbessern. Überwachen Sie Kennzahlen wie die Bearbeitungszeit von Bestellungen, die Lösungsquote im Kundenservice, den Lagerumschlag und die Betriebskosten pro Transaktion.
Diese Effizienzgewinne finanzieren häufig weitere Investitionen in die Umgestaltung und schaffen so einen positiven Kreislauf der Verbesserung.
Häufig gestellte Fragen
- Was bedeutet digitale Transformation für B2C-Unternehmen?
Die digitale Transformation im B2C-Bereich beinhaltet die Integration digitaler Technologien in alle verbraucherorientierten Abläufe, um die Art und Weise, wie Unternehmen Werte schaffen und mit Kunden interagieren, grundlegend zu verändern. Dazu gehören die Modernisierung von Systemen, die Schaffung nahtloser Omnichannel-Erlebnisse, die Nutzung von Daten für die Personalisierung und die Einführung kundenorientierter Designprinzipien an allen Kontaktpunkten.
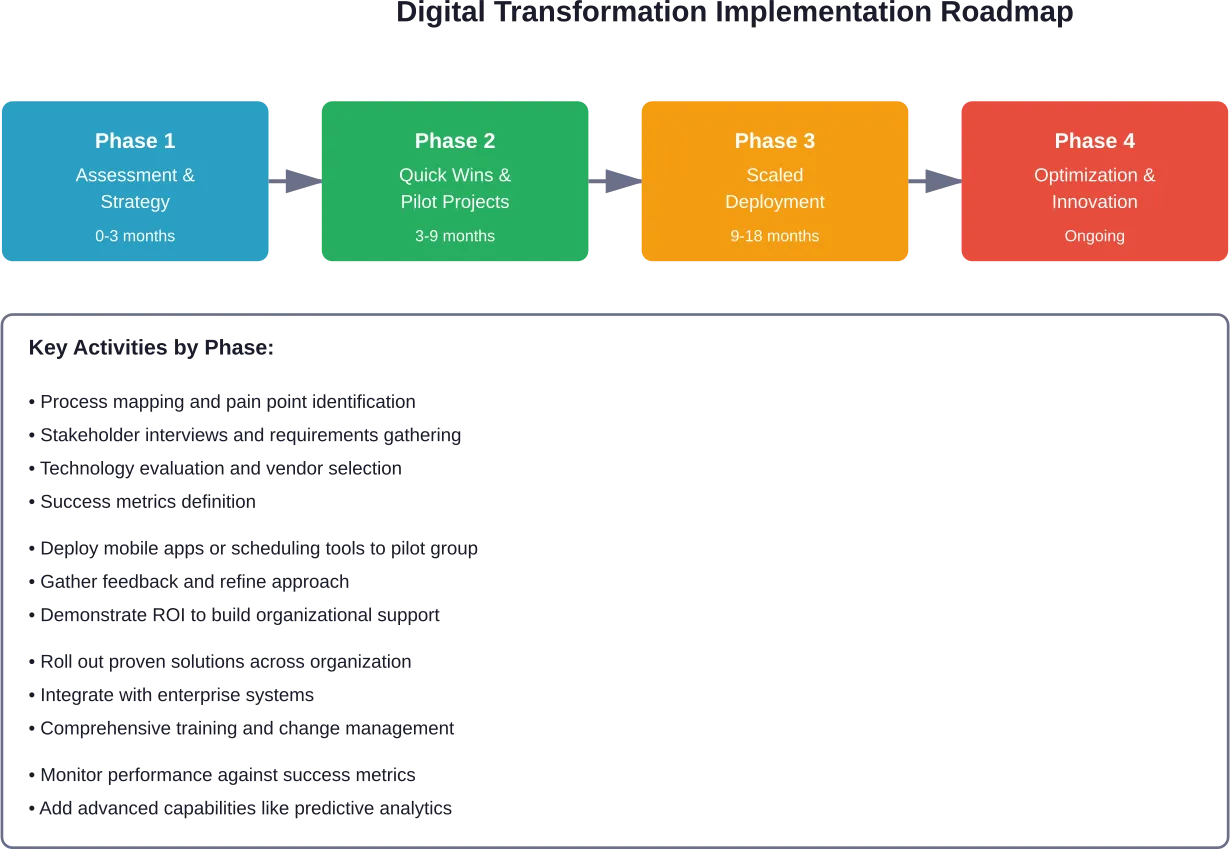
- Wie lange dauert die digitale Transformation im B2C-Bereich?
Die meisten umfassenden digitalen Transformationen im B2C-Bereich benötigen 18-24 Monate für die Kernimplementierung, wobei Unternehmen die Transformation als einen fortlaufenden Prozess und nicht als einmaliges Projekt betrachten sollten. Quick Wins können in 3-6 Monaten durch gezielte Initiativen erzielt werden, während der Aufbau grundlegender Fähigkeiten in der Regel 9-12 Monate dauert. Der Zeitrahmen hängt von der Größe des Unternehmens, der Komplexität des Altsystems und dem Umfang der Transformation ab.
- Was sind die größten Herausforderungen bei der digitalen Transformation im B2C-Bereich?
Zu den häufigsten Herausforderungen gehören die Integration von Altsystemen, der Widerstand des Unternehmens gegen Veränderungen, die Einhaltung des Datenschutzes, Budgetbeschränkungen und fehlende Fachkenntnisse. Viele Unternehmen haben auch Probleme mit der Definition klarer Erfolgsmetriken und der Unterstützung durch die Geschäftsleitung während mehrjähriger Initiativen. Die Bewältigung dieser Herausforderungen erfordert strategische Planung, Investitionen in das Änderungsmanagement und schrittweise Implementierungsansätze.
- Wie viel kostet die digitale Transformation im B2C-Bereich?
Die Kosten für die Umgestaltung variieren je nach Unternehmensgröße und -umfang erheblich. Untersuchungen der Columbia Business School haben gezeigt, dass eine erfolgreiche Umgestaltung des Kundenerlebnisses bei kleineren Initiativen ein Budget von $300.000 erfordert, während unternehmensweite Umgestaltungen bei großen B2C-Unternehmen Investitionen von mehreren Millionen Dollar erfordern können. Die meisten Unternehmen sollten 2-5% des Jahresumsatzes für sinnvolle Umgestaltungsmaßnahmen einplanen.
- Müssen B2C-Unternehmen ihren gesamten Technologie-Stack neu aufbauen?
Ein vollständiger Technologieaustausch ist für die meisten Unternehmen weder notwendig noch ratsam. Erfolgreiche Transformationen umfassen in der Regel eine schrittweise Modernisierung - das Hinzufügen von API-Schichten, um Altsysteme mit modernen Plattformen zu verbinden, die Migration bestimmter Funktionen auf Cloud-basierte Lösungen und den schrittweisen Ersatz veralteter Systeme, je nachdem, wie es die geschäftlichen Prioritäten erfordern. Dieser Ansatz reduziert das Risiko und erhält gleichzeitig die Geschäftskontinuität.
- Wie unterscheidet sich die digitale Transformation im B2C-Bereich von der im B2B-Bereich?
Die B2C-Transformation konzentriert sich auf Transaktionen mit hohem Volumen und geringem Wert, mit kürzeren Entscheidungszyklen und stärker emotionalen Kauffaktoren. Die Erwartungen der Verbraucher in Bezug auf Geschwindigkeit, Komfort und Personalisierung sind höher und werden durch führende digitale Plattformen beeinflusst. B2C hat auch mit einem größeren Kundenstamm zu tun, was im Vergleich zum B2B-Kontext skalierbarere Systeme und andere Datenverwaltungsansätze erfordert.
- Welche Rolle spielt das Marketing bei der digitalen Transformation im B2C-Bereich?
Das Marketing steht im Zentrum der B2C-Transformation und verbindet Kundenerfahrung mit Unternehmenstechnologie. Die Forrester-Studie zeigt, dass Marketingverantwortliche mit der KI-Disruption, den sich entwickelnden Messverfahren und der Marktfragmentierung zurechtkommen müssen, ohne dabei die Grundlagen des Markenaufbaus zu vernachlässigen. Marketingteams treiben die Strategie für Kundendaten, die Gestaltung von Omnichannel-Erlebnissen und die Taktiken für das digitale Engagement voran, die sich direkt auf den Erfolg der Transformation auswirken.
Vorwärts mit der digitalen Transformation
Die digitale Transformation für B2C-Unternehmen ist ein strategischer Imperativ, keine optionale Initiative. Die Erwartungen der Verbraucher steigen weiter, der Wettbewerbsdruck nimmt zu und die technologischen Möglichkeiten erweitern sich - Unternehmen, die sich nicht anpassen, riskieren, an Relevanz zu verlieren.
Für die Umgestaltung sind jedoch keine riesigen Budgets oder ein umfassender Austausch bestehender Abläufe erforderlich. Die erfolgreichsten Initiativen beginnen mit klaren, kundenorientierten Zielen, bauen schrittweise grundlegende Fähigkeiten auf und halten den organisatorischen Fokus durch die Unterstützung der Geschäftsleitung und das Change Management aufrecht.
Der Weg in die Zukunft führt über die Erfassung der aktuellen Customer Journeys, die Identifizierung von Chancen mit großer Wirkung, die Auswahl geeigneter Technologien und die Umsetzung von Änderungen durch agile Methoden, die Lernen und Anpassungen ermöglichen. Erfolg erfordert Geduld, Ausdauer und die Bereitschaft, sich an veränderte Umstände anzupassen.
Unternehmen, die die digitale Transformation mit Bedacht angehen, positionieren sich für nachhaltiges Wachstum in zunehmend digitalen Märkten. Diejenigen, die zögern, stehen vor wachsenden Herausforderungen, da die Kluft zwischen den digitalen Vorreitern und den Nachzüglern immer größer wird. Der Zeitpunkt, mit der Transformation zu beginnen, ist nicht erst dann, wenn sie bequem wird - sondern jetzt.