Kurze Zusammenfassung: Die digitale Transformation für den Außendienst umfasst die Implementierung mobiler Technologien, IoT-Sensoren, KI-gestützter Analysen und Automatisierungstools zur Modernisierung des Außendienstbetriebs. Jüngsten Untersuchungen zufolge verzeichnen Unternehmen, die diese Technologien einsetzen, Produktivitätssteigerungen von bis zu 25% und eine Verringerung der Geräteausfälle um 70% durch vorausschauende Wartungsfunktionen.
Ineffiziente Zeitplanung. Pannen in der Kommunikation. Berge von Papierkram.
Außendienstorganisationen haben täglich mit diesen Problemen zu kämpfen, während die Budgets knapper werden und sich der Fachkräftemangel verschärft. Aber die Sache ist die: Die digitale Transformation ist nicht nur ein weiteres Schlagwort. Sie verändert die Art und Weise, wie der Außendienst arbeitet, grundlegend, und Unternehmen, die sich darauf einlassen, erzielen messbare Ergebnisse.
Untersuchungen zeigen, dass bei fast der Hälfte aller digitalen Transformationen die Verbesserung des Kundenerlebnisses im Vordergrund steht. Der Druck kommt von beiden Seiten: Kunden und Mitarbeiter fordern heute die digitalen Technologien, die sie im Alltag nutzen.
Das Außendienstmanagement ist komplexer geworden. Techniker arbeiten an mehreren Standorten, die Geräte werden immer anspruchsvoller, und die Erwartungen an den Service steigen ständig. Herkömmliche Methoden können da einfach nicht mithalten.
Was ist die digitale Transformation im Außendienst?
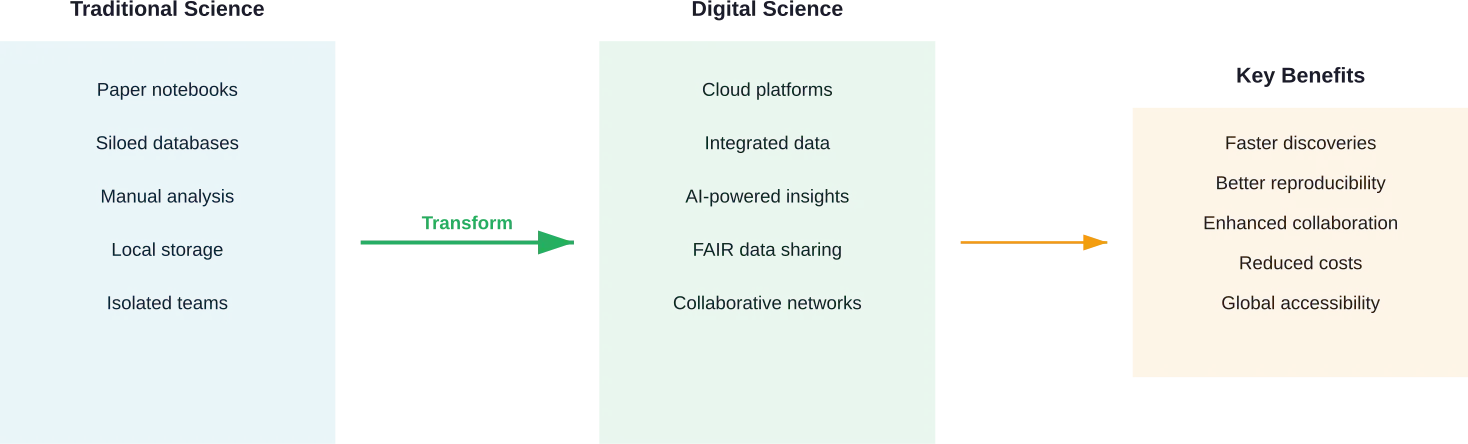
Unter digitaler Transformation im Außendienst versteht man die umfassende Koordination und Optimierung von Aufgaben, Ressourcen und Personal durch moderne Technik. Sie umfasst alles von der Planung von Serviceeinsätzen über das Ressourcenmanagement bis hin zur Einsatzplanung und Unterstützung der Techniker vor Ort beim Kunden.
Das ultimative Ziel? Rationalisierung des Außendienstes, Verbesserung der Reaktionszeiten und bessere Serviceergebnisse.
Aber es geht um mehr als den Austausch von Papierformularen gegen Tablets. Eine echte Transformation integriert mehrere Technologien - IoT-Sensoren, künstliche Intelligenz, Cloud-Plattformen und mobile Anwendungen - in ein zusammenhängendes System, das die Art und Weise, wie Arbeit erledigt wird, grundlegend verändert.
Software für das Field Service Management (FSM) steht im Mittelpunkt dieses Wandels. Diese Plattformen verbinden Disponenten, Techniker, Kunden und Backend-Systeme in Echtzeit und schaffen so eine Transparenz, die mit herkömmlichen Ansätzen unmöglich war.
Moderne Außendiensteinsätze erfordern zunehmend integrierte IoT-, KI- und Cloud-Technologien, um effektiv zu funktionieren, wobei verschiedene Systeme nahtlos miteinander kommunizieren.
Warum sich Außendienstorganisationen digitale Technologien zunutze machen
Der Business Case für die digitale Transformation im Außendienst beruht auf mehreren konkreten Vorteilen, die sich direkt auf das Endergebnis auswirken.
Erhöhte Kundenzufriedenheit
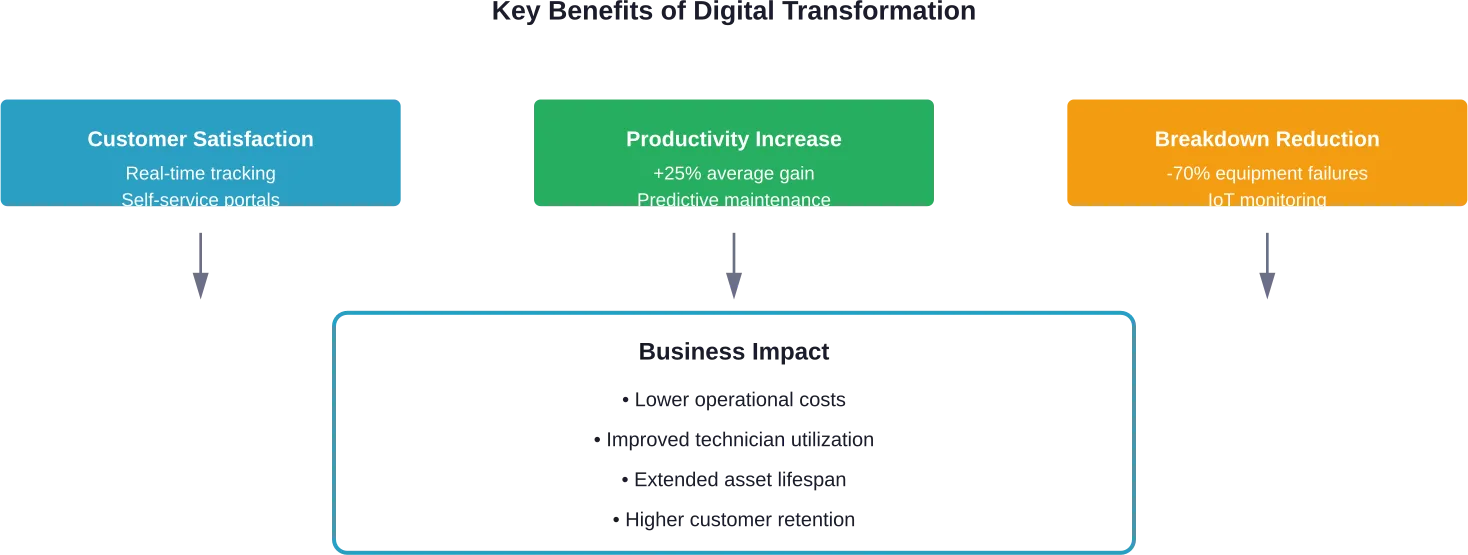
Fast die Hälfte aller digitalen Umgestaltungen nennt bessere Kundenerfahrungen als entscheidenden Faktor. Die Kunden wünschen sich genaue Ankunftszeitfenster, Echtzeit-Updates und Erstbehebungsraten, die tatsächlich den Erwartungen entsprechen.
Digitale Werkzeuge erfüllen diese Erwartungen. Über mobile Apps können die Kunden den Standort des Technikers in Echtzeit verfolgen. Automatische Benachrichtigungen halten sie während des gesamten Serviceeinsatzes auf dem Laufenden. Selbstbedienungsportale ermöglichen es ihnen, Termine zu vereinbaren, auf die Servicehistorie zuzugreifen und einfache Probleme zu lösen, ohne auf einen Techniker zu warten.
Laut Deloitte's 2026 Field Service Report bieten 50% der Unternehmen Self-Service an, aber nur 31% liefern “optimierte” Self-Service-Erfahrungen. Diese Lücke stellt sowohl eine Herausforderung als auch eine Chance dar.
Operative Effizienz und Produktivitätssteigerungen
Laut einer Deloitte-Studie steigert die vorausschauende Instandhaltung die Produktivität um durchschnittlich 25% und reduziert Ausfälle um 70%. Dies sind keine marginalen Verbesserungen - es sind transformative Veränderungen, die sich direkt auf die Rentabilität auswirken.
Vorausschauende Wartung verlängert die Lebensdauer von Anlagen, verringert das Unfallrisiko, senkt die Reparaturkosten und erhöht die Produktivität der Techniker vor Ort. IoT-Sensoren überwachen Geräte kontinuierlich und erkennen potenzielle Ausfälle, bevor sie auftreten. KI-Algorithmen analysieren Muster, um die vorbeugende Wartung zu optimalen Zeitpunkten zu planen.
Die Effizienzgewinne gehen über die Wartung hinaus. Digitale Planungstools optimieren automatisch die Routen und reduzieren so die Fahrzeit und die Kraftstoffkosten. Über mobile Anwendungen haben Techniker sofortigen Zugriff auf Gerätehandbücher, Servicehistorien und Ersatzteilbestände.
Datengestützte Entscheidungsfindung
Traditionelle Außendiensteinsätze basierten auf Bauchgefühl und unvollständigen Informationen. Die digitale Transformation ändert dies grundlegend, indem sie umfassende Daten zu jedem Aspekt des Betriebs liefert.
Unternehmen können nun wichtige Leistungsindikatoren in Echtzeit verfolgen: Erstbehebungsraten, durchschnittliche Servicezeit, Technikerauslastung, Kundenzufriedenheit und Zuverlässigkeitskennzahlen der Geräte. Diese Transparenz ermöglicht eine kontinuierliche Verbesserung, die auf tatsächlichen Leistungsdaten und nicht auf Annahmen beruht.
Analyseplattformen erkennen Muster, die Menschen möglicherweise übersehen. Welche Gerätemodelle fallen am häufigsten aus? Welche Techniker liefern durchweg die besten Ergebnisse? In welchen Servicefenstern ist die Kundenzufriedenheit am höchsten? Diese Erkenntnisse ermöglichen eine intelligentere Ressourcenzuweisung und strategische Planung.

Kerntechnologien für die Transformation des Außendienstes
Mehrere Technologien arbeiten zusammen, um eine umfassende digitale Transformation im Außendienst zu ermöglichen. Wenn Unternehmen verstehen, wie sie miteinander verbunden sind, können sie effektive Technologiepakete aufbauen.
Mobile Außendienstanwendungen
Mobile Technologie fördert den flexiblen Einsatz von Außendienstmitarbeitern. Techniker, die mit Tablets oder Smartphones ausgestattet sind, haben überall Zugriff auf wichtige Informationen: Arbeitsaufträge, Kundenhistorien, Gerätespezifikationen und Anleitungen zur Fehlerbehebung.
Moderne mobile Apps ermöglichen eine Zwei-Wege-Kommunikation zwischen Außendienstmitarbeitern und Disponenten. Statusaktualisierungen erfolgen automatisch, wenn Techniker Aufgaben erledigen. Fotos und Videos dokumentieren den Zustand der Ausrüstung. Digitale Unterschriften ermöglichen die sofortige Freigabe durch den Kunden.
Der Mobilitätsvorteil geht über den Informationszugang hinaus. Die GPS-Integration ermöglicht eine Standortverfolgung in Echtzeit, eine optimierte Routenführung und genaue Schätzungen der Ankunftszeit. Offline-Funktionen stellen sicher, dass Techniker auch ohne Verbindung effektiv arbeiten können, da die Daten synchronisiert werden, sobald die Verbindung wiederhergestellt ist.
Internet der Dinge (IoT) Sensoren
IoT-Sensoren machen den Außendienst von reaktiv zu proaktiv. Vernetzte Geräte überwachen sich selbst kontinuierlich und melden Leistungskennzahlen, Nutzungsmuster und Frühwarnzeichen für potenzielle Ausfälle.
IoT-Sensoren ermöglichen eine Echtzeit-Überwachung, die den operativen Ansatz im Außendienst verändert. Service-Organisationen erhalten Warnungen, bevor Kunden Probleme überhaupt bemerken.
Durch die Umstellung von planmäßiger Wartung auf zustandsabhängige Wartung werden unnötige Serviceeinsätze reduziert und unerwartete Ausfälle verhindert. Die Ressourcen werden dort eingesetzt, wo sie tatsächlich benötigt werden, und nicht dort, wo es ein vorgegebener Zeitplan vorschreibt.
Künstliche Intelligenz und maschinelles Lernen
Die KI-Funktionen im Außendienst haben sich rasant entwickelt. Laut Deloitte's 2026 Field Service Report nutzen derzeit 40% der Unternehmen GenAI für Analyse, Reporting, Technikerunterstützung und Aufgabenautomatisierung.
Algorithmen des maschinellen Lernens analysieren historische Servicedaten, um Geräteausfälle mit zunehmender Genauigkeit vorherzusagen. Sie optimieren die Einsatzplanung, indem sie Faktoren wie die Fähigkeiten der Techniker, die Verfügbarkeit von Ersatzteilen, Verkehrsmuster und die Komplexität des Service gleichzeitig berücksichtigen.
KI-gesteuerte Chatbots bearbeiten routinemäßige Kundenanfragen, so dass menschliche Mitarbeiter für komplexe Probleme frei werden. Intelligente Routing-Systeme weisen Arbeitsaufträge automatisch dem am besten qualifizierten verfügbaren Techniker zu. Empfehlungssysteme schlagen auf der Grundlage ähnlicher früherer Fälle optimale Reparaturverfahren vor.
Visuelle Fernunterstützung
Die visuelle Fernunterstützungstechnologie ermöglicht es Servicetechnikern, bei der Lösung von Problemen vor Ort fachkundige Hilfe zu erhalten. Außerdem können Kunden Serviceorganisationen auf Probleme aufmerksam machen, ohne dass eine sofortige physische Untersuchung erforderlich ist.
Augmented-Reality-Anwendungen überlagern digitale Informationen mit physischen Geräten. Ein junger Techniker, der eine komplexe Maschine über ein Tablet betrachtet, sieht beschriftete Komponenten, schrittweise Reparaturanweisungen und Sicherheitswarnungen, die der realen Ansicht überlagert werden.
Remote-Experten nehmen virtuell an Serviceanrufen teil, sehen, was der Techniker vor Ort sieht, und geben in Echtzeit Hilfestellung. Dieser Ansatz der Zusammenarbeit reduziert Eskalationen, verbessert die Erstbehebungsrate und beschleunigt den Wissenstransfer.
Cloud-basierte Plattformen
Die Cloud-Infrastruktur bildet die Grundlage für die Verbindung all dieser Technologien. Zentrale Plattformen fassen Daten aus mobilen Apps, IoT-Sensoren, Kundensystemen und Unternehmensressourcenplanungstools zusammen.
Die Cloud-Bereitstellung bietet mehrere Vorteile gegenüber Systemen vor Ort: schnellere Implementierung, automatische Updates, Skalierbarkeit ohne Hardware-Investitionen und Zugriff von jedem Ort mit Internetanschluss.
Die Integrationsfähigkeit ist von enormer Bedeutung. Moderne Außendienstmanagement-Plattformen lassen sich über APIs mit CRM-Systemen, Bestandsmanagement, Abrechnungssoftware und Kommunikationstools verbinden und schaffen so einen nahtlosen Informationsfluss im gesamten Unternehmen.
Umsetzung der digitalen Transformation im Außendienst
Kommt Ihnen das bekannt vor - mehrere Altsysteme, Widerstand gegen Veränderungen, Budgetbeschränkungen? Die erfolgreiche Umgestaltung des Außendienstes erfordert strategische Planung und methodische Umsetzung.
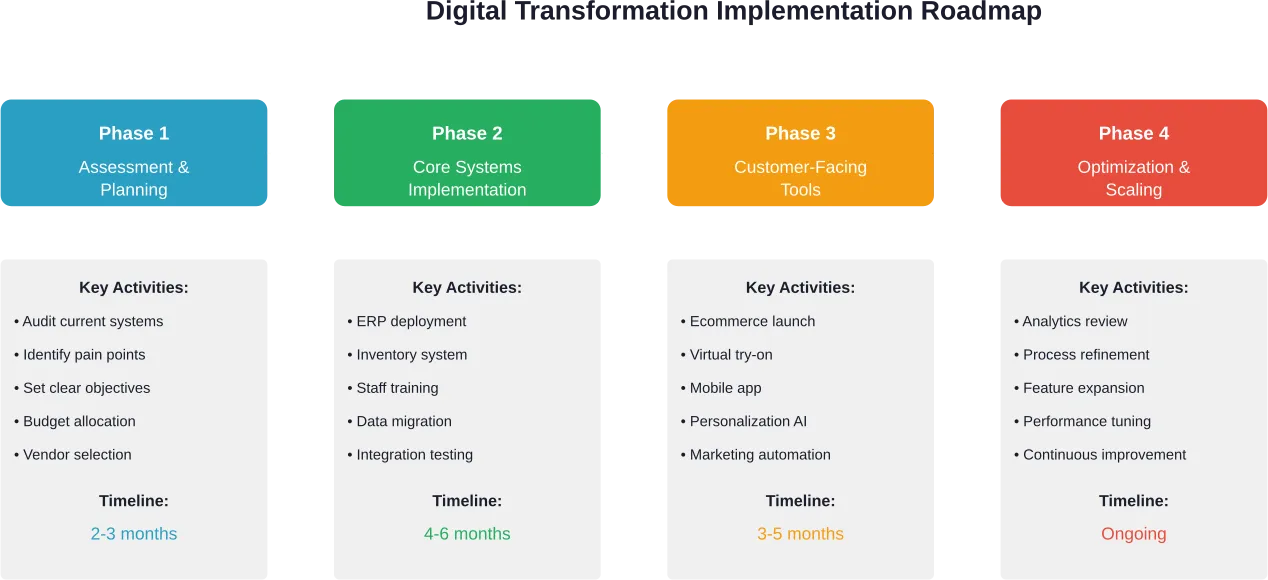
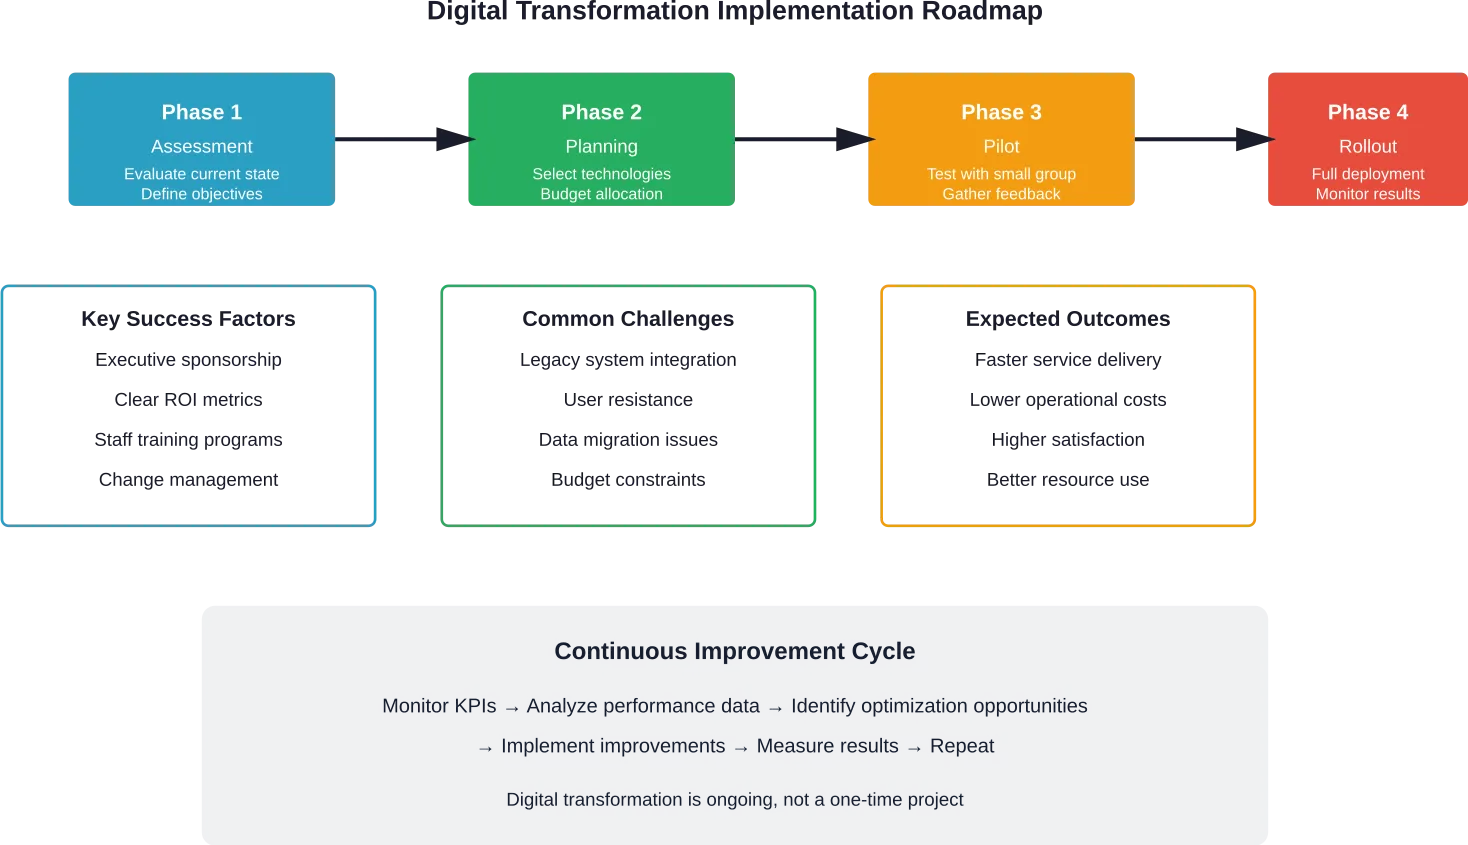
Bewertung des aktuellen Zustands und Definition von Zielen
Der Wandel beginnt mit einer ehrlichen Bewertung. Unternehmen brauchen einen klaren Überblick über die aktuelle Leistung: Wie lange dauert es durchschnittlich, bis ein Serviceeinsatz abgeschlossen ist? Wie viel Prozent der Aufträge erfordern einen erneuten Besuch? Wie zufrieden sind die Kunden? Womit haben die Techniker vor Ort am meisten zu kämpfen?
Die Ausgangsdaten bilden den Ausgangspunkt. Konkrete, messbare Ziele definieren den Erfolg: Reduzierung der durchschnittlichen Servicezeit um 20%, Erhöhung der Erstbehebungsrate auf 85%, Verbesserung der Kundenzufriedenheit um 15 Punkte.
Die Festlegung von Prioritäten ist wichtig, denn ein Wandel vollzieht sich nicht über Nacht. Welche Probleme verursachen die meisten Schmerzen? Welche Verbesserungen bringen die größte Wirkung? Konzentrieren Sie Ihre Bemühungen auf die Bereiche, in denen sie den größten Nutzen bringen.
Den richtigen Technologie-Stack aufbauen
Nicht jedes Unternehmen braucht jede Technologie. Das richtige Paket hängt von den spezifischen betrieblichen Anforderungen, der vorhandenen Infrastruktur und den strategischen Prioritäten ab.
Kleine Betriebe können mit mobiler Außendienstsoftware und cloudbasierter Terminplanung beginnen. Größere Unternehmen, die komplexe Anlageninvestitionen verwalten, rechtfertigen IoT-Sensornetzwerke und vorausschauende Analyseplattformen.
Integrationsfähigkeiten verdienen eine ernsthafte Bewertung. Systeme, die nicht miteinander kommunizieren, schaffen Datensilos und manuelle Umgehungen - genau das, was die digitale Transformation beseitigen sollte.
| Technologie-Komponente | Primäre Funktion | Am besten für |
|---|
| Mobile FSM-Software | Verwaltung von Arbeitsaufträgen, Aktualisierungen in Echtzeit | Alle Außendiensttätigkeiten |
| IoT-Sensoren | Geräteüberwachung, vorausschauende Wartung | Organisationen, die kritische Vermögenswerte verwalten |
| KI-Analytik | Mustererkennung, Optimierung | Groß angelegte Operationen mit umfangreichen Daten |
| Visuelle Fernunterstützung | Fachkundige Zusammenarbeit, geführte Reparaturen | Instandhaltung komplexer Anlagen |
| Kundenportale | Selbstbedienung, Terminplanung | Großvolumige Dienstleistungen für Verbraucher |
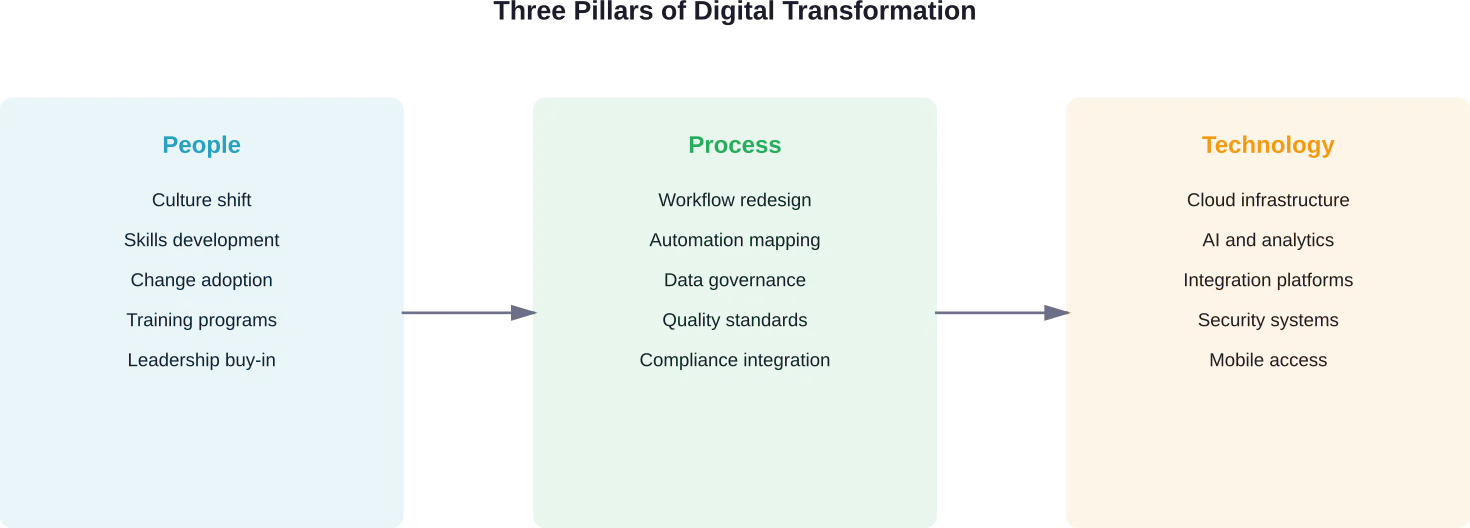
Änderungsmanagement proaktiv angehen
Die Einführung von Technologien scheitert, wenn menschliche Faktoren außer Acht gelassen werden. Techniker im Außendienst, die an papierbasierte Prozesse gewöhnt sind, brauchen Schulungen, Unterstützung und überzeugende Gründe, um neue Ansätze zu übernehmen.
Beziehen Sie die Mitarbeiter an der Front frühzeitig ein. Sie kennen die betrieblichen Realitäten, die dem Büropersonal möglicherweise entgehen. Ihr Beitrag verbessert das Systemdesign und schafft Akzeptanz für künftige Änderungen.
Kommunikation ist während des gesamten Transformationsprozesses wichtig. Erklären Sie, warum die Veränderungen stattfinden, welche Vorteile sie bringen und wie sie sich auf die tägliche Arbeit auswirken werden. Sprechen Sie Bedenken ehrlich an, anstatt sie abzutun.
Beginnen Sie mit Pilotprogrammen, bevor Sie das gesamte Unternehmen einführen. Testen Sie neue Systeme mit kleinen Gruppen, sammeln Sie Feedback, verfeinern Sie die Prozesse und erweitern Sie sie dann schrittweise. Schnelle Erfolge geben Schwung und zeigen Skeptikern den Wert.
Fokus auf Datenqualität und Sicherheit
Die digitale Transformation erzeugt riesige Mengen an Daten. Diese Daten bieten nur dann einen Wert, wenn sie genau, vollständig und zugänglich sind.
Führen Sie frühzeitig Data-Governance-Verfahren ein. Wer ist für die Datenqualität verantwortlich? Welche Standards gelten? Wie werden Fehler korrigiert? Saubere Daten, die in Systeme eingehen, führen zu zuverlässigen Erkenntnissen.
Die Sicherheit verdient große Aufmerksamkeit. Außendienstsysteme enthalten sensible Kundeninformationen, geschützte Gerätedaten und Wettbewerbsinformationen. Laut NIST Special Publication 800-63-4 über Richtlinien zur digitalen Identität sind ordnungsgemäße Authentifizierungs- und Zugangskontrollen die Grundlage für den Schutz von Systemen vor unbefugtem Zugriff.
Regelmäßige Sicherheitsbewertungen zeigen Schwachstellen auf, bevor sie ausgenutzt werden. Mitarbeiterschulungen verringern menschliches Versagen, das die Systeme gefährdet. Sicherungs- und Wiederherstellungsverfahren gewährleisten die Geschäftskontinuität, wenn Probleme auftreten.

Reparieren Sie den Außendienst, ohne die Teams zu verlangsamen
Die digitale Transformation im Außendienst sollte die Koordination vereinfachen und nicht noch mehr Schichten zu bereits komplexen Abläufen hinzufügen. A-listware arbeitet mit Unternehmen zusammen, die verbessern müssen, wie ihre Systeme, Prozesse und Daten den täglichen Betrieb unterstützen. Sie beginnen mit der Bewertung der aktuellen Arbeitsabläufe, Tools und des Datenflusses und erstellen dann einen Transformationsplan, der sich daran orientiert, wie Teams unter realen Bedingungen arbeiten. Dazu gehören in der Regel die Verbesserung der Systemintegration, die Reduzierung manueller Eingaben und der standortübergreifende Zugriff auf Daten, damit Entscheidungen schneller und mit weniger Lücken getroffen werden können.
Für den Außendienst bedeutet dies oft eine bessere Koordinierung zwischen Büro- und Vor-Ort-Teams, eine zuverlässigere Berichterstattung und Werkzeuge, die sich in realen Arbeitsumgebungen bewähren. A-listware deckt den gesamten Prozess ab, von der Analyse und Strategie bis hin zur Implementierung und laufenden Unterstützung, so dass die Abläufe auch bei der Einführung von Änderungen weiterlaufen. Wenn sich Ihre Arbeitsabläufe vor Ort fragmentiert oder schwieriger zu verwalten anfühlen, als sie sein sollten, ist es sinnvoll, sich direkt an A-listware und prüfen, was vereinfacht werden kann.
Messung des Erfolgs der digitalen Transformation
Was gemessen wird, wird verwaltet. Die Verfolgung der richtigen Metriken entscheidet darüber, ob Transformationsinitiativen den versprochenen Wert liefern.
Operative Metriken
Die Erstbehebungsrate misst den Prozentsatz der Serviceeinsätze, die beim ersten Besuch gelöst werden. Höhere Raten weisen auf besser vorbereitete Techniker hin, die Zugang zu den erforderlichen Informationen und Teilen haben.
Die durchschnittliche Dauer der Dienstleistung zeigt, wie lange typische Aufträge dauern. Verkürzungen deuten auf eine verbesserte Effizienz hin, ohne dass die Qualität darunter leiden muss.
Die Technikerauslastung berechnet die abrechenbaren Stunden als Prozentsatz der Gesamtarbeitszeit. Optimierte Planung und reduzierter Verwaltungsaufwand erhöhen dieses Verhältnis.
Die Anlagenverfügbarkeit wird durch die Betriebszeit überwacht. Vorausschauende Wartung sollte diese Kennzahl deutlich erhöhen, indem sie unerwartete Ausfälle verhindert.
Metriken zur Kundenerfahrung
Die Kundenzufriedenheitswerte erfassen die Gesamtqualität der Serviceerfahrung. Mehrere Messpunkte - Umfragen nach dem Service, Net Promoter Score, Online-Bewertungen - liefern ein umfassendes Feedback.
Bei der Einhaltung von Service Level Agreements wird die Leistung gegenüber den vertraglichen Verpflichtungen überwacht. Digitale Systeme verbessern die Transparenz dieser Verpflichtungen und automatisieren die Eskalation, wenn Fristen näher rücken.
Die Reaktionszeit misst, wie schnell Unternehmen auf Serviceanfragen reagieren. Schnellere Antworten korrelieren in der Regel mit höherer Zufriedenheit.
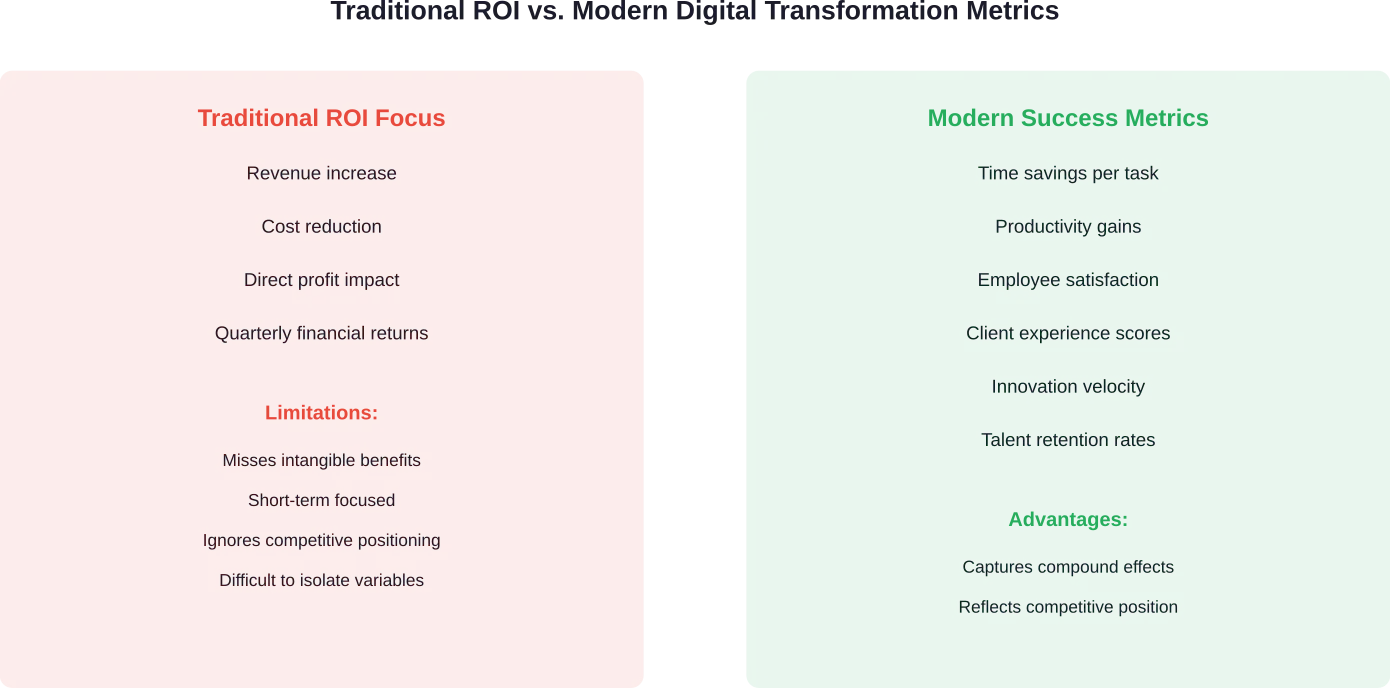
Finanzielle Metriken
Die Kosten pro Serviceanruf geben Aufschluss über die betriebliche Effizienz. Die digitale Transformation sollte diese Kennzahl durch optimiertes Routing, verbesserte Erstlösungsraten und geringeren Verwaltungsaufwand senken.
Der Umsatz pro Techniker zeigt die Produktivität des Personals an. Bessere Werkzeuge ermöglichen es jedem Techniker, mehr Aufträge zu erledigen oder komplexere Aufgaben zu bewältigen.
Bei der Berechnung der Kapitalrendite werden die Umstellungskosten den messbaren Vorteilen gegenübergestellt: geringere Arbeitskosten, weniger Notreparaturen, höhere Kundenbindungsraten.
Aufkommende Trends, die die digitale Transformation des Außendienstes prägen
Die Außendiensttechnologie entwickelt sich rasant weiter. Unternehmen, die langfristige Strategien planen, sollten diese Entwicklungstrends beobachten.
Generative AI-Anwendungen
GenAI wird im Außendienst bereits in 40% der Unternehmen für Analysen, Berichte, Technikerunterstützung und Aufgabenautomatisierung eingesetzt. Dieser Prozentsatz wird wahrscheinlich erheblich steigen, wenn die Funktionen ausgereift sind und die Anwendungsfälle erweitert werden.
Künftige Anwendungen könnten die automatische Generierung von Arbeitsaufträgen auf der Grundlage von Kundenbeschreibungen, intelligente Teileempfehlungen auf der Grundlage der Gerätehistorie und Verfahrensanpassungen in Echtzeit auf der Grundlage von Feldbedingungen umfassen.
Digitale Zwillingstechnologie
Die Technologie des digitalen Zwillings wurde für Anwendungen zur Ressourcen- und Anlagenverfolgung im Rahmen des Außendienstmanagements erforscht, bei denen virtuelle Repliken physische Geräte widerspiegeln.
Digitale Zwillinge ermöglichen Simulationen und Tests, ohne den tatsächlichen Betrieb zu unterbrechen. Unternehmen können verschiedene Wartungsstrategien modellieren, das Verhalten von Anlagen unter verschiedenen Bedingungen vorhersagen und die Leistung aus der Ferne optimieren.
5G-Netzausbau
Die Forschung zur digitalen Transformation in der Öl- und Gasindustrie untersucht 5G NR-U-Modelle für digitale private Multiservice-Netze. Diese Hochgeschwindigkeitsverbindungen mit geringer Latenz ermöglichen eine Datenübertragung in Echtzeit, die bisher nicht möglich war.
Techniker vor Ort können hochauflösende Videos zur Fernunterstützung ohne Verbindungsprobleme übertragen. IoT-Sensoren übertragen kontinuierlich Datenströme. Augmented-Reality-Anwendungen reagieren sofort auf Benutzerbewegungen.
Erweiterte Automatisierung
Die Workflow-Automatisierung erledigt bereits Routineaufgaben: Terminbestätigungen, Ersatzteilbestellungen, Rechnungserstellung. In Zukunft wird die Automatisierung immer komplexere Prozesse bewältigen.
Intelligente Systeme könnten bei Notfällen selbstständig Termine verschieben, bei dringenden Anrufen automatisch den nächstgelegenen qualifizierten Techniker schicken oder im Voraus Ersatzteile bestellen, wenn Sensoren eine nachlassende Leistung der Geräte feststellen.
Häufig zu vermeidende Fallstricke
Unternehmen machen bei Initiativen zur digitalen Transformation häufig vorhersehbare Fehler. Bewusstheit hilft, diese Fallen zu vermeiden.
Technologie ohne Strategie
Die Einführung von Technologie um ihrer selbst willen bringt selten einen Mehrwert. Jede digitale Initiative sollte eindeutig mit spezifischen Geschäftszielen und betrieblichen Verbesserungen verbunden sein.
Die neueste KI-Plattform hilft nicht, wenn die Kernprozesse nicht funktionieren. Beheben Sie zuerst die Prozessprobleme und setzen Sie dann die Technologie ein, um effektive Arbeitsabläufe zu optimieren.
Change Management wird unterschätzt
Brillante Technologieimplementierungen scheitern, wenn die Menschen sich weigern, sie zu nutzen. Das Änderungsmanagement verdient die gleiche Aufmerksamkeit wie die technische Einführung.
Der Widerstand beruht oft auf berechtigten Bedenken: Angst vor Arbeitsplatzverlust, Unsicherheit über neue Aufgaben, Frustration über schlecht gestaltete Schnittstellen. Sprechen Sie diese Probleme direkt an, anstatt sie als Eigensinn abzutun.
Vernachlässigung der Integration
Best-of-Breed-Systeme schaffen nur dann einen Mehrwert, wenn sie effektiv kommunizieren. Datensilos beseitigen die Vorteile der Transparenz, die Investitionen in die digitale Transformation rechtfertigen.
Beurteilen Sie die Integrationsmöglichkeiten während der Auswahl des Anbieters, nicht erst nach dem Kauf. Die Verfügbarkeit von APIs, die Kompatibilität von Datenformaten und die Häufigkeit von Aktualisierungen beeinflussen, wie gut die Systeme zusammenarbeiten.
Unzureichende Ausbildung
Komplexe Systeme erfordern eine angemessene Schulung. Schnelle Überblicksschulungen bereiten die Benutzer nicht auf die realen Szenarien vor, denen sie begegnen werden.
Praktische Übungen in sicheren Umgebungen anbieten. Erstellen Sie Referenzmaterialien für allgemeine Aufgaben. Einrichtung von Support-Kanälen für Fragen, die nach der ersten Schulung auftreten.
Häufig gestellte Fragen
- Wie sieht der typische ROI-Zeitplan für die digitale Transformation des Außendienstes aus?
Der ROI-Zeitrahmen variiert je nach Unternehmensgröße, Technologieumfang und aktuellem Reifegrad erheblich. Im Allgemeinen sehen Unternehmen die ersten Gewinne innerhalb von 6-12 Monaten durch Effizienzsteigerungen und geringere Betriebskosten. Der volle ROI wird oft erst nach 18-36 Monaten erreicht, wenn die Systeme ausgereift sind und die Prozessoptimierungen zunehmen. Untersuchungen haben ergeben, dass die Produktivität durch vorausschauende Wartung um 25% und die Zahl der Ausfälle um 70% steigen kann, aber die Realisierung dieser Vorteile braucht Zeit.
- Wie viel kostet eine Software für das Außendienstmanagement normalerweise?
Die Preise variieren stark je nach Funktionen, Benutzerzahl und Bereitstellungsmodell. Die Lösungen reichen von einfachen Planungstools bis hin zu umfassenden Plattformen, die IoT-, KI- und Mobilfunktionen integrieren. Informieren Sie sich auf den Websites der Anbieter über die aktuellen Preise, da sich die Abonnementmodelle und Funktionsstufen häufig ändern. Die meisten Anbieter bieten abgestufte Pläne an, die auf die Größe und Komplexität des Unternehmens abgestimmt sind.
- Können kleine Außendienstunternehmen von der digitalen Transformation profitieren?
Ganz genau. Auch wenn kleine Unternehmen keine Lösungen im Unternehmensmaßstab benötigen, profitieren sie doch enorm von der mobilen Verwaltung von Arbeitsaufträgen, automatischer Terminplanung und Tools für die Kundenkommunikation. Viele Anbieter bieten Lösungen an, die speziell für kleinere Betriebe entwickelt wurden, mit niedrigeren Preisen und vereinfachten Funktionen. Selbst mit einfachen digitalen Tools lässt sich Papierkram vermeiden, Planungsfehler reduzieren und die Kundenkommunikation verbessern.
- Welche Fähigkeiten brauchen Techniker im Außendienst für den Erfolg der digitalen Transformation?
Am wichtigsten ist die digitale Grundkompetenz: der sichere Umgang mit Tablets oder Smartphones, die Fähigkeit, in Anwendungen zu navigieren, die Bereitschaft, neue Tools zu erlernen. Die meisten modernen Softwarelösungen für den Außendienst zeichnen sich durch intuitive Schnittstellen aus, die nur minimale technische Kenntnisse erfordern. Unternehmen sollten angemessene Schulungen und fortlaufenden Support anbieten, anstatt von den Technikern zu erwarten, dass sie komplexe Systeme eigenständig verstehen. Mit der zunehmenden Verbreitung von IoT und vernetzten Geräten werden technische Fähigkeiten zur Fehlerbehebung immer wichtiger.
- Wie kann die digitale Transformation die Kundenzufriedenheit im Außendienst verbessern?
Digitale Tools sorgen für eine Reihe von Verbesserungen der Kundenerfahrung. Die Verfolgung von Technikern in Echtzeit liefert genaue Ankunftszeitfenster. Automatische Benachrichtigungen halten die Kunden während des gesamten Serviceeinsatzes auf dem Laufenden. Selbstbedienungsportale ermöglichen die Terminplanung ohne Telefonanrufe. Mobil ausgerüstete Techniker haben Zugriff auf die komplette Servicehistorie, was die Erstbehebungsrate verbessert. Untersuchungen zufolge sind verbesserte Kundenerfahrungen für fast die Hälfte aller Initiativen zur digitalen Transformation ausschlaggebend, da sich die Zufriedenheit direkt auf die Kundenbindung und den Umsatz auswirkt.
- Welche Sicherheitsbedenken sollten Unternehmen bei der digitalen Transformation des Außendienstes berücksichtigen?
Außendienstsysteme enthalten sensible Kundendaten, geschützte Ausrüstungsinformationen und Wettbewerbsinformationen, die geschützt werden müssen. Nach den NIST-Richtlinien bilden angemessene Authentifizierungs- und Zugangskontrollen die Grundlage der digitalen Sicherheit. Unternehmen sollten verschlüsselte Datenübertragungen, rollenbasierte Zugriffsberechtigungen, regelmäßige Sicherheitsaudits und Mitarbeiterschulungen zu Phishing- und Social-Engineering-Bedrohungen einführen. Mobile Geräte benötigen eine Fernlöschfunktion für verlorene oder gestohlene Geräte. Cloud-Anbieter sollten die Einhaltung der einschlägigen Sicherheitsstandards und -vorschriften nachweisen.
- Wie lassen sich IoT-Sensoren in den bestehenden Außendienstbetrieb integrieren?
IoT-Sensoren überwachen die Geräteleistung und übertragen Daten an Cloud-Plattformen, die Muster analysieren und potenzielle Probleme erkennen. Wenn Sensoren Anomalien erkennen - ungewöhnliche Temperaturen, Vibrationen oder Leistungsabfall -, lösen sie Warnungen in Außendienstmanagementsystemen aus. Diese Warnungen generieren automatisch Arbeitsaufträge, planen vorbeugende Wartungsmaßnahmen oder benachrichtigen Kunden über mögliche Probleme. Durch die Integration wird der Betrieb von reaktiven Reparaturen auf proaktive Wartung umgestellt, wodurch Notrufe reduziert und die Lebensdauer der Geräte verlängert werden. Die Implementierung erfordert die Installation von Sensoren, Netzwerkverbindungen und die Integration von Plattformen, bietet jedoch einen erheblichen langfristigen Nutzen.
Schlussfolgerung
Die digitale Transformation verändert grundlegend die Art und Weise, wie Außendienstorganisationen arbeiten, konkurrieren und Werte schaffen. Die Technologien, die diesen Wandel ermöglichen - mobile Anwendungen, IoT-Sensoren, KI-Analysen und Cloud-Plattformen - arbeiten zusammen, um Transparenz, Effizienz und Kundenerlebnisse zu schaffen, die mit herkömmlichen Ansätzen nicht möglich sind.
Die Forschung zeigt konkrete Vorteile auf: Produktivitätssteigerungen um 25%, 70% weniger Geräteausfälle, verbesserte Kundenzufriedenheit bei fast der Hälfte der Umstellungsinitiativen. Dies sind keine theoretischen Vorteile. Unternehmen, die digitale Strategien umsetzen, berichten von messbaren Verbesserungen bei betrieblichen und finanziellen Kennzahlen.
Aber Technologie allein ist keine Erfolgsgarantie. Strategische Planung, Änderungsmanagement, Data Governance und kontinuierliche Verbesserung unterscheiden Transformationen, die einen dauerhaften Wert liefern, von Implementierungen, die enttäuschen.
Die Außendienstlandschaft entwickelt sich weiter. Die Einführung von GenAI nimmt zu, die Technologie des digitalen Zwillings reift, 5G-Netzwerke ermöglichen neue Möglichkeiten. Unternehmen, die sich der Transformation stellen, sind in der Lage, sich an den technologischen Fortschritt anzupassen.
Beginnen Sie mit einer ehrlichen Bewertung der aktuellen Abläufe. Ermitteln Sie die größten Probleme und die wertvollsten Möglichkeiten. Erstellen Sie ein Technologiepaket, das auf die spezifischen Bedürfnisse abgestimmt ist, anstatt jedem Trend hinterherzulaufen. Beziehen Sie Ihre Mitarbeiter während des gesamten Prozesses mit ein. Messen Sie die Ergebnisse konsequent und optimieren Sie kontinuierlich.
Die digitale Transformation ist nicht mehr optional - sie ist von grundlegender Bedeutung, um auf modernen Außendienstmärkten wettbewerbsfähig zu bleiben. Die Frage ist nicht, ob man transformieren soll, sondern wie schnell und effektiv Unternehmen den Übergang vollziehen können.