Résumé rapide : La transformation numérique pour le B2C permet aux entreprises de moderniser l'expérience client grâce à l'adoption de technologies, à la personnalisation axée sur les données et à l'engagement omnicanal. Les organisations qui adoptent ces changements constatent une amélioration de la satisfaction des clients, de l'efficacité opérationnelle et du positionnement concurrentiel. Pour réussir, il faut une planification stratégique, une conception centrée sur le client et une adaptation continue à l'évolution des attentes des consommateurs dans un marché de plus en plus numérique.
Le paysage de la relation entreprise-consommateur n'est plus ce qu'il était il y a cinq ans. Les attentes des consommateurs ont radicalement changé, exigeant des expériences numériques transparentes qui reflètent la commodité et la personnalisation auxquelles ils se sont habitués dans leur vie quotidienne.
Pour les entreprises B2C, la transformation numérique ne se limite pas à la création d'un site web ou au lancement d'une application. Il s'agit de repenser fondamentalement la manière dont les entreprises s'engagent avec leurs clients à chaque point de contact, depuis la découverte initiale jusqu'à l'assistance après l'achat.
Or, les entreprises qui retardent cette transformation risquent de perdre leur pertinence face à des concurrents qui se dotent de capacités numériques plus importantes. L'écart entre les leaders numériques et les retardataires continue de se creuser chaque année.
Comprendre la transformation numérique B2C
La transformation numérique dans le contexte B2C implique l'intégration des technologies numériques dans tous les domaines des opérations en contact avec les consommateurs. Cela modifie fondamentalement la manière dont les entreprises apportent de la valeur et interagissent avec les clients.
Selon les recherches de la Columbia Business School sur la conception de l'expérience client, l'évolution du marketing traditionnel centré sur les aspects fonctionnels des produits vers une conception globale de l'expérience client (CX) représente un changement stratégique important. La gestion des produits, qui se concentrait autrefois uniquement sur les capacités, donne désormais la priorité aux approches fondées sur l'expérience.
Le changement va au-delà des interactions frontales avec les clients. Il touche les opérations, les chaînes d'approvisionnement, la gestion des données et la culture organisationnelle. Les entreprises doivent adapter l'ensemble de leur modèle d'entreprise pour répondre aux exigences des consommateurs natifs du numérique qui attendent un accès instantané, une personnalisation et des expériences omnicanales transparentes.
Pourquoi la transformation B2C diffère-t-elle de la transformation B2B ?
La transformation de l'entreprise vers le consommateur est confrontée à des défis distincts de ceux des contextes B2B. Les transactions des consommateurs impliquent généralement des valeurs individuelles plus faibles mais des volumes beaucoup plus importants. Le cycle d'achat est plus court, souvent impulsif et fortement influencé par des facteurs émotionnels plutôt que par une évaluation rationnelle.
Les clients B2C attendent une gratification immédiate. Ils ne tolèrent pas une navigation complexe, des temps de chargement lents ou des expériences fragmentées d'un appareil à l'autre. La barre est fixée par les leaders du secteur : chaque entreprise B2C est en concurrence avec les expériences transparentes proposées par les principales plateformes, quel que soit le secteur d'activité.
Les données de Forrester révèlent que seulement 25% des décideurs en matière de protection de la vie privée font état d'une collaboration entre l'équipe chargée de la protection de la vie privée et les services de marketing de leur organisation. Cette situation présente un risque important pour les entreprises B2C, où le marketing est intrinsèquement tourné vers le client et gourmand en données.
Transformation numérique pour les entreprises B2C
Les entreprises B2C ont besoin de systèmes rapides, évolutifs et sécurisés pour servir efficacement leurs clients. A-listware aide à mettre en œuvre des plates-formes modernes et fournit une assistance technique à long terme.
Domaines clés :
- commerce électronique et applications mobiles
- les outils d'engagement des clients et de gestion de la relation client (CRM)
- analyse des données et personnalisation
- infrastructure en nuage sécurisée
L'équipe peut renforcer votre personnel ou gérer des projets entiers. Commencez votre transformation B2C avec Logiciel de liste A aujourd'hui.
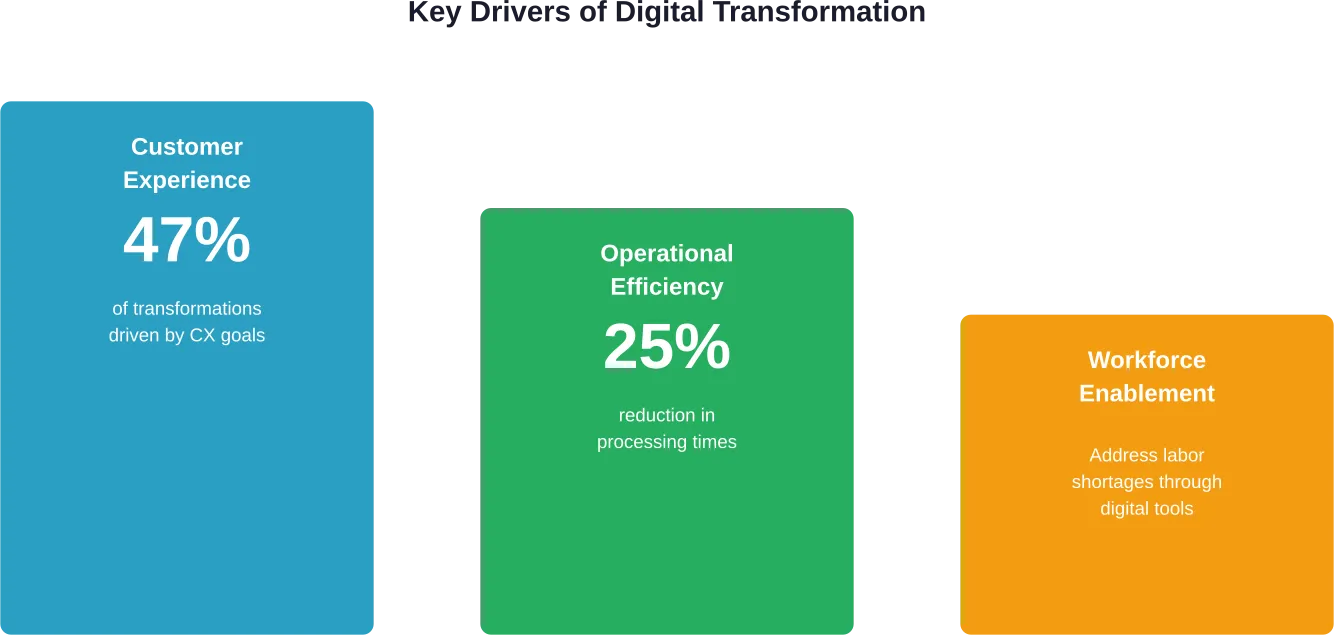
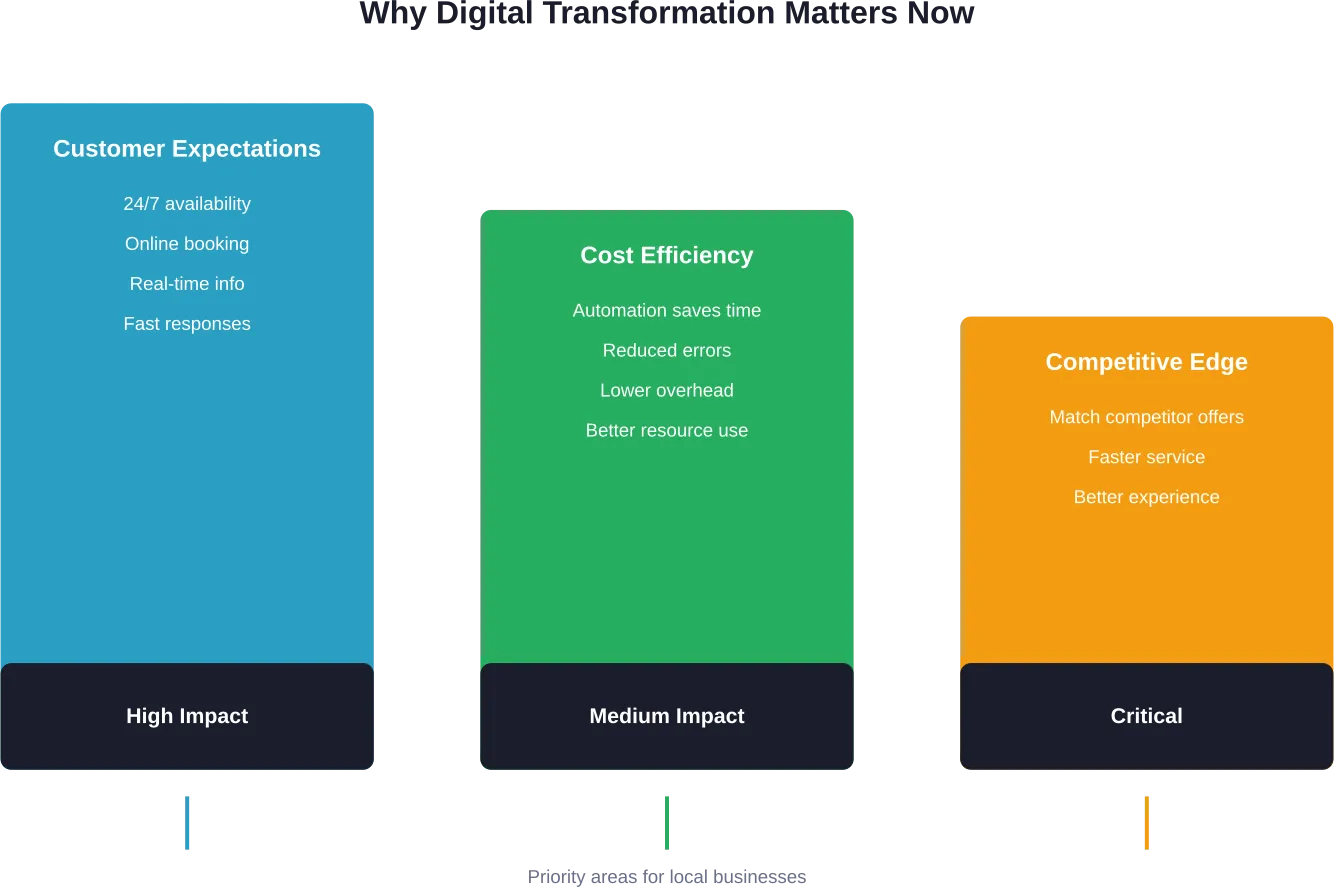
Les facteurs clés qui remodèlent le commerce B2C
Plusieurs forces accélèrent la transformation numérique sur les marchés de consommation. Comprendre ces moteurs permet de hiérarchiser les initiatives de transformation et d'allouer les ressources de manière efficace.
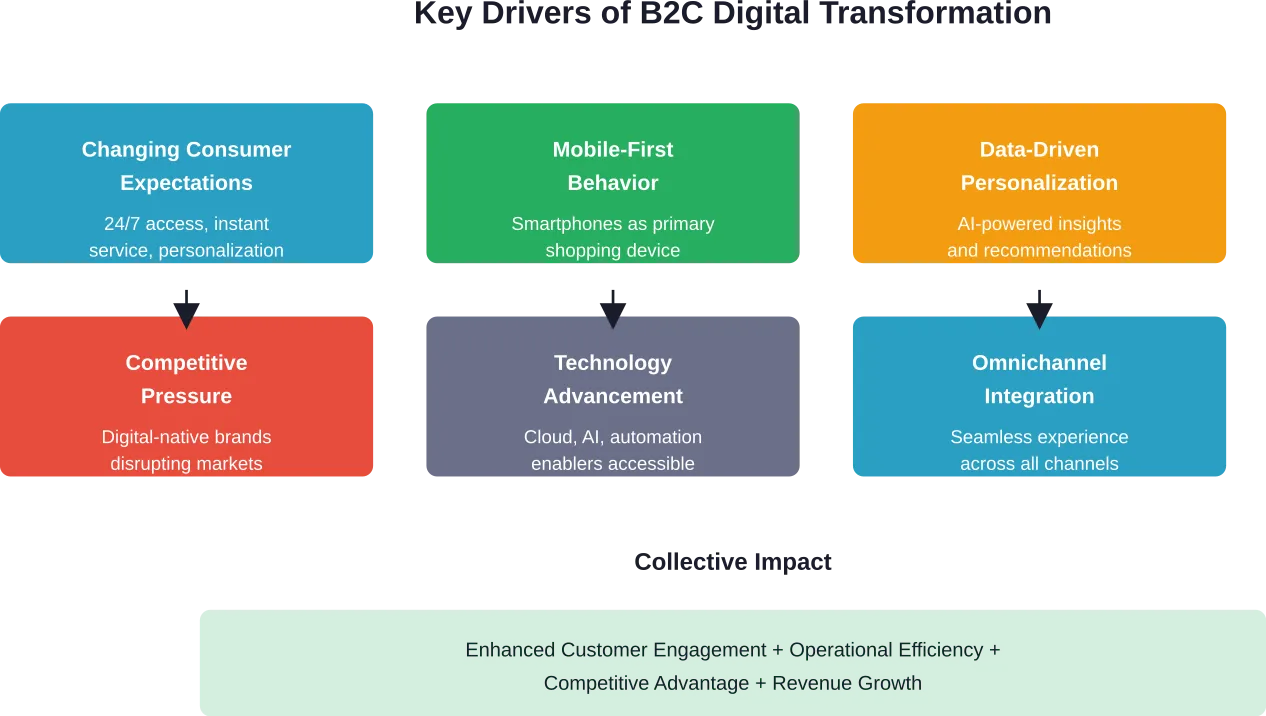
Les attentes des consommateurs continuent d'augmenter
Les consommateurs attendent désormais des marques qu'elles connaissent leurs préférences, qu'elles anticipent leurs besoins et qu'elles leur offrent des expériences cohérentes, qu'ils fassent leurs achats via une application mobile, un site web, les médias sociaux ou un magasin physique. Cette attente s'étend au-delà de la transaction elle-même, pour inclure le service client, les retours et l'engagement continu.
La recherche de Dartmouth sur les clients numériques met en évidence la manière dont les technologies numériques ont fondamentalement fait basculer l'équilibre du pouvoir en faveur des consommateurs. Ils utilisent des outils numériques pour recueillir des informations et évaluer les options de dépenses, exigeant des entreprises qu'elles répondent en améliorant l'expérience client, en proposant des prix compétitifs et en s'alignant davantage sur les valeurs des clients.
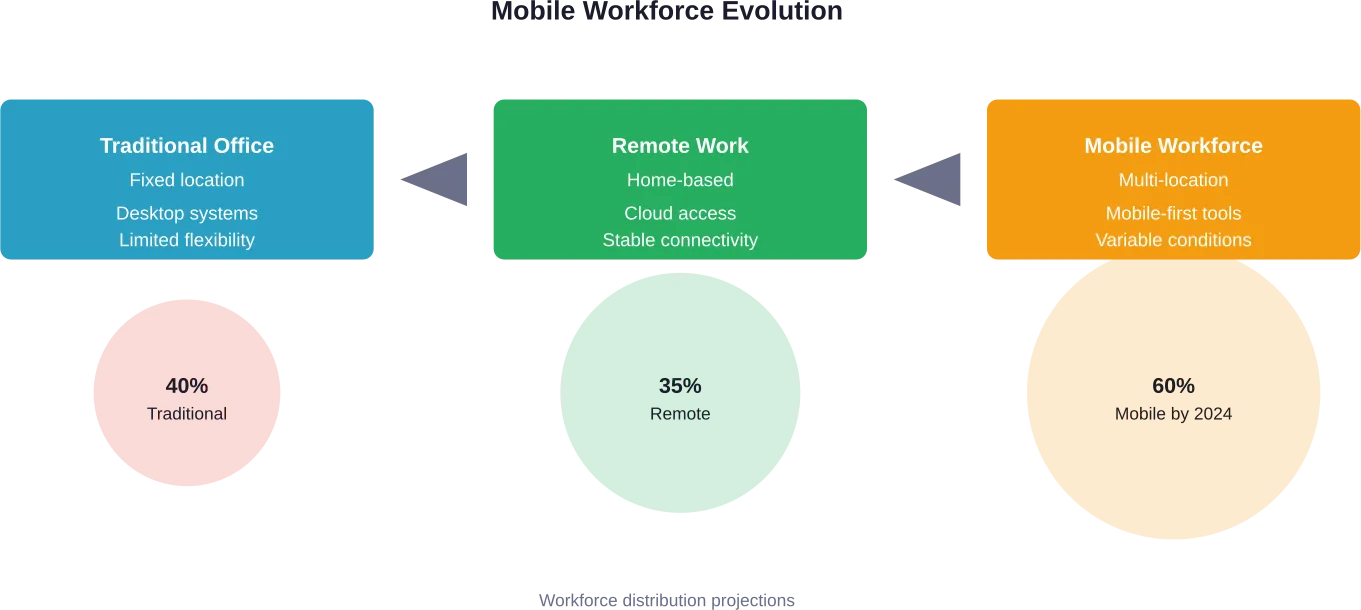
Le mobile comme canal principal
Le smartphone est devenu l'appareil central des interactions avec les consommateurs. Les entreprises doivent optimiser chaque point de contact numérique pour les expériences mobiles, non pas comme une réflexion après coup, mais comme la première considération en matière de conception.
La conception "mobile-first" ne se limite pas à des mises en page réactives. Elle englobe les options de paiement, les modèles de navigation, les temps de chargement et le formatage du contenu qui tient compte de la manière dont les consommateurs utilisent leurs appareils tout au long de la journée.
Exigences en matière de données et de personnalisation
Les consommateurs attendent de plus en plus des recommandations personnalisées, des offres ciblées et un contenu qui reflète leurs préférences individuelles et leur historique d'achat. Cela nécessite une collecte, une analyse et une application sophistiquées des données à travers tous les points de contact avec les clients.
Mais c'est là que les choses se compliquent. Les préoccupations et les réglementations en matière de protection de la vie privée créent des tensions entre les souhaits de personnalisation et les exigences en matière de protection des données. Les données de Forrester montrent que seulement 25% des équipes chargées de la protection de la vie privée collaborent efficacement avec les services marketing, ce qui crée des lacunes dans la manière dont les entreprises traitent les données des clients de manière responsable tout en offrant des expériences personnalisées.
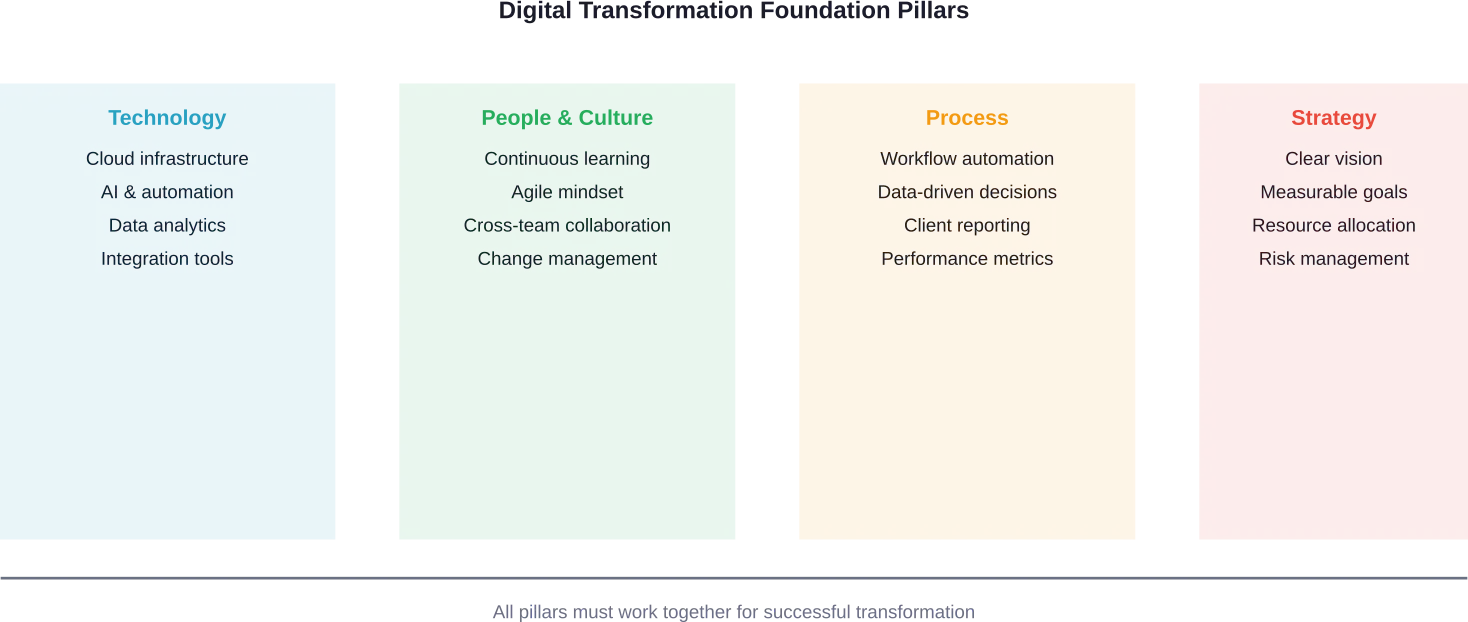
Composantes essentielles de la transformation numérique B2C
Les initiatives de transformation réussies partagent plusieurs éléments communs. Ces éléments s'associent pour créer des expériences numériques cohérentes qui stimulent les résultats de l'entreprise.
| Composant | Description | Impact sur les entreprises |
|---|---|---|
| Plate-forme de données clients | Des profils de clients unifiés à travers tous les points de contact | Permet la personnalisation et des expériences cohérentes |
| Commerce omnicanal | Des achats en toute transparence sur le web, le mobile, le social et le physique | Augmentation des taux de conversion et de la satisfaction des clients |
| Automatisation du marketing | Communications déclenchées en fonction du comportement | Améliore l'engagement et réduit les efforts manuels |
| IA et analyse | Perspectives et recommandations prédictives | Optimisation des stocks, de la tarification et du ciblage des clients |
| Paiements numériques | Options de paiement multiples, y compris les portefeuilles numériques | Réduire les frictions et les transactions abandonnées |
| Technicien du service à la clientèle | Chatbots, portails en libre-service, assistance assistée par l'IA | Réduire les coûts tout en améliorant les temps de réponse |
L'approche fondée sur l'expérience plutôt que sur les capacités
Les recherches de la Columbia Business School sur la conception de l'expérience client mettent en évidence un changement critique de stratégie. Une étude de cas décrite selon la recherche de la Columbia Business School, une entreprise avec une faible notoriété de marque et un produit compliqué est passée d'une approche basée sur les capacités à une approche basée sur l'expérience avec un budget ne dépassant pas $300 000.
Cette conception axée sur l'expérience a permis d'améliorer considérablement l'engagement des clients. La leçon à en tirer ? La transformation numérique ne nécessite pas nécessairement des budgets colossaux, mais plutôt une réflexion stratégique sur la manière de concevoir des expériences qui trouvent un écho auprès des clients.
Construire des écosystèmes de collaboration
Les recherches du MIT Sloan Management Review sur les écosystèmes collaboratifs soulignent que la transformation nécessite de plus en plus de partenariats tout au long de la chaîne de valeur. Les entreprises B2C ne peuvent pas tout construire en interne.
Les partenariats stratégiques avec des fournisseurs de technologie, des entreprises de logistique, des sociétés de traitement des paiements et des sociétés d'analyse de données permettent une transformation plus rapide et l'accès à des capacités spécialisées sans avoir à créer des solutions propriétaires pour chaque besoin.
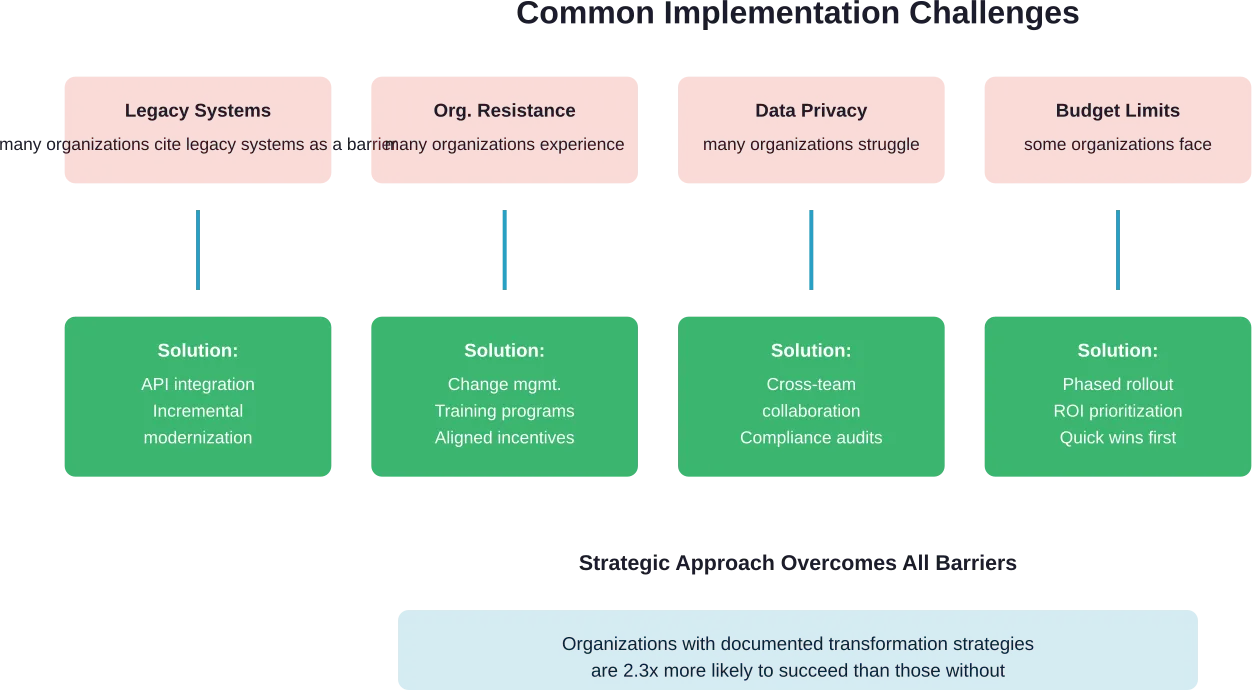
Défis et solutions de mise en œuvre
La transformation numérique n'est pas un chemin tout tracé. Les organisations rencontrent des obstacles prévisibles qui peuvent faire dérailler les initiatives ou allonger considérablement les délais.
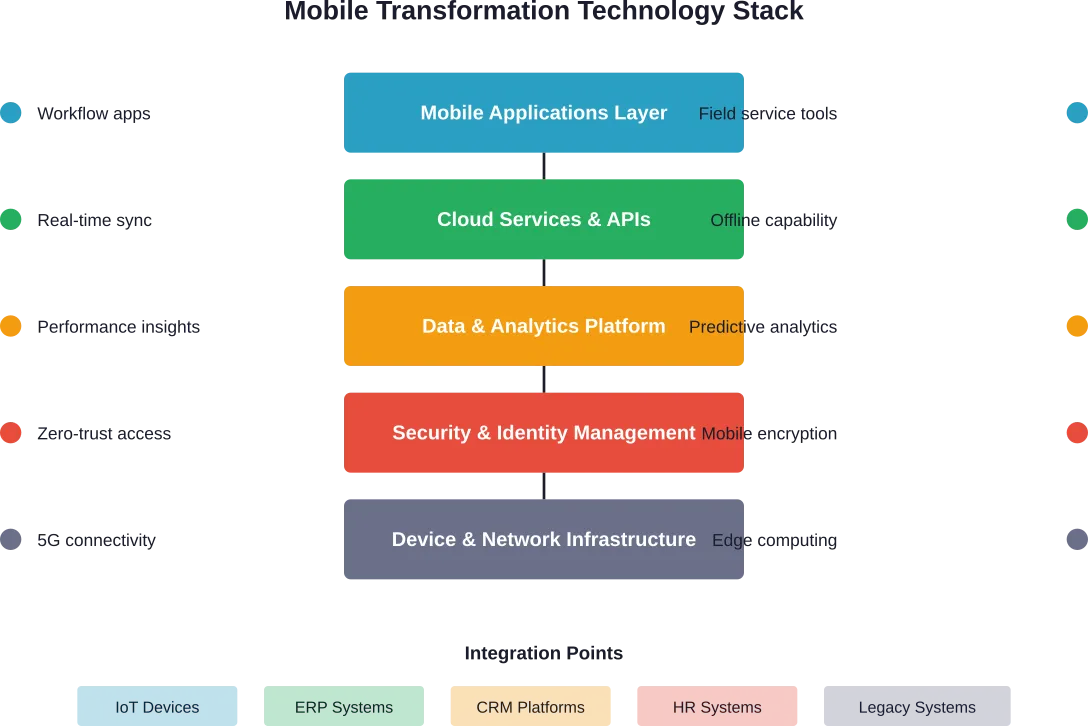
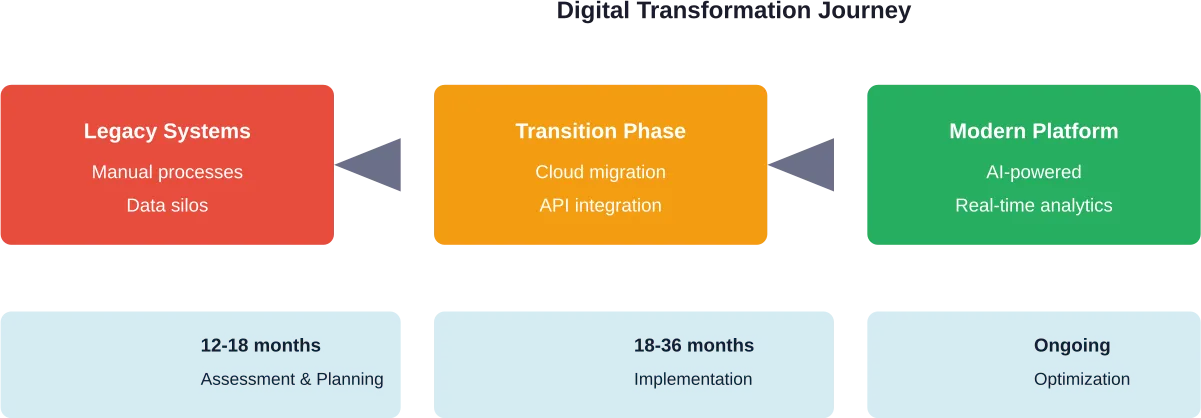
Intégration des systèmes existants
De nombreuses entreprises B2C utilisent une infrastructure technologique obsolète qui n'a pas été conçue pour les expériences numériques modernes. Ces anciens systèmes ne peuvent souvent pas s'intégrer facilement aux nouvelles plateformes numériques, ce qui crée des silos de données et des inefficacités opérationnelles.
La solution passe par une modernisation progressive plutôt que par un remplacement complet. Des couches d'API peuvent relier les anciens et les nouveaux systèmes tout en migrant progressivement les fonctions vers des plateformes modernes. Cette approche permet de réduire les risques et de maintenir la continuité des activités pendant la transformation.
Résistance organisationnelle
La transformation numérique nécessite un changement culturel, et pas seulement une mise en œuvre technologique. Les employés habitués aux processus traditionnels peuvent résister aux nouveaux flux de travail, outils et mesures de performance.
Les organisations performantes investissent dans la gestion du changement dès le début du projet. Cela comprend une communication claire sur les objectifs de la transformation, des programmes de formation qui renforcent les compétences numériques et des structures d'incitation alignées sur les nouvelles méthodes de travail.
Confidentialité des données et conformité
Des réglementations telles que la loi INFORM CONSUMERS de la FTC et la loi CAN-SPAM établissent des exigences concernant la manière dont les entreprises B2C collectent, stockent et utilisent les données de leurs clients. Le non-respect de ces règles est passible de sanctions importantes.
Selon les orientations de la FTC, la loi CAN-SPAM s'applique à tous les messages commerciaux (y compris les courriels) dont l'objectif principal est la publicité ou la promotion commerciale, et pas seulement aux courriels en nombre Les entreprises doivent fournir des mécanismes clairs de désinscription et honorer rapidement les demandes de désinscription.
Pour les vendeurs en ligne qui vendent beaucoup, la loi INFORMER les consommateurs exige que les marchés en ligne vérifient les informations sur les vendeurs et rendent certains détails accessibles au public. Cela concerne les entreprises B2C qui vendent par l'intermédiaire de plateformes tierces.
Lacunes en matière de compétences et pénurie de talents
La transformation numérique nécessite des capacités dont beaucoup d'organisations B2C traditionnelles manquent en interne. La science des données, le design UX, l'architecture cloud et l'automatisation du marketing numérique exigent tous des compétences spécialisées.
Les organisations y remédient en combinant l'embauche, la formation du personnel existant et le partenariat avec des agences ou des consultants spécialisés. Certaines s'appuient également sur des équipes de développement et d'assistance délocalisées pour accéder à des viviers de talents mondiaux à des structures de coûts différentes.
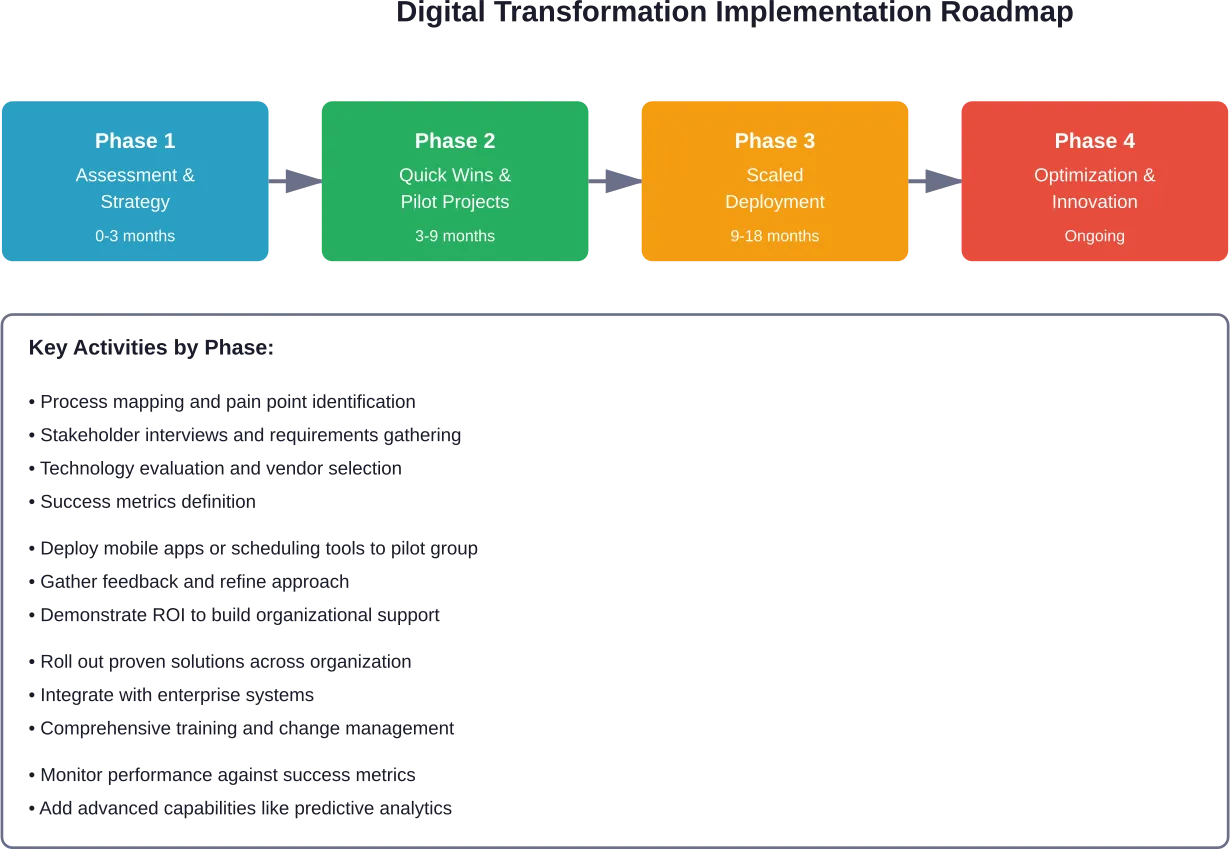
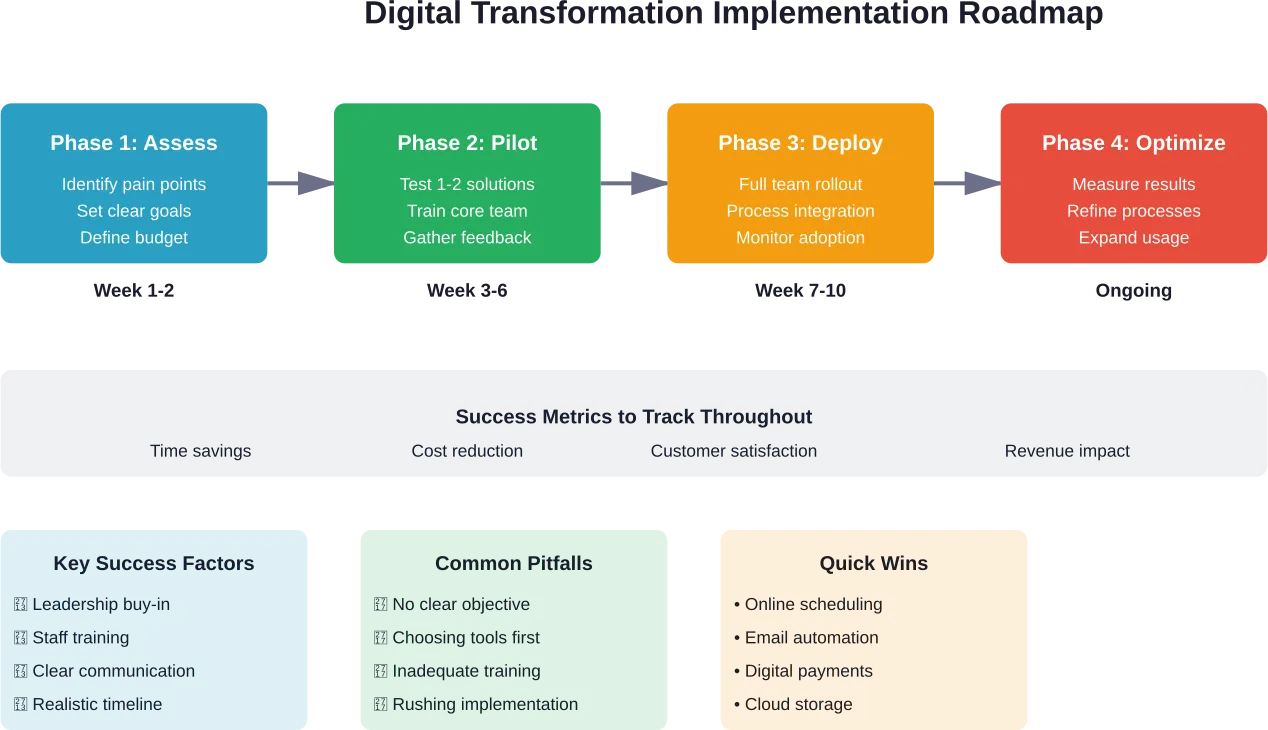
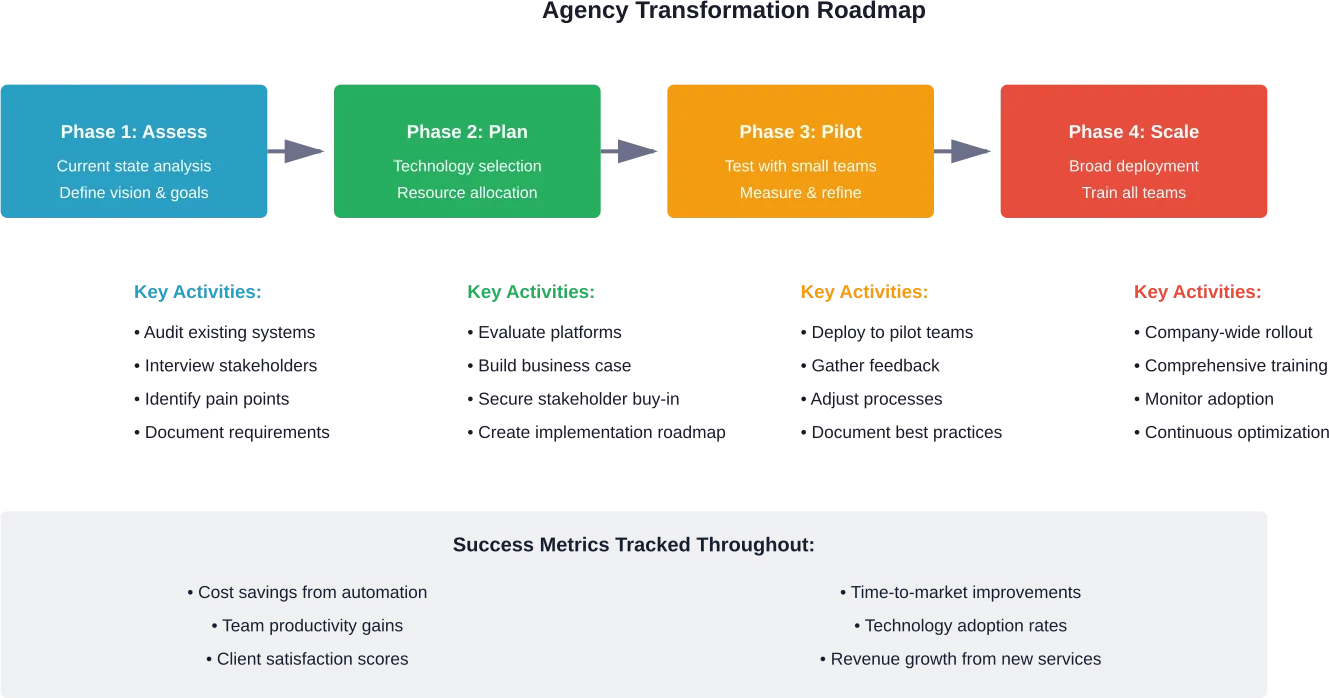
Stratégies pour une transformation B2C réussie
Les organisations qui réussissent leur transformation suivent des modèles qui minimisent les risques tout en maximisant l'impact sur l'entreprise.
Commencez par établir une cartographie du parcours du client
Avant de mettre en œuvre une nouvelle technologie, cartographiez les parcours actuels des clients à travers tous les points de contact. Identifiez les points douloureux, les moments de friction et les possibilités d'amélioration.
Cette approche centrée sur le client garantit que les efforts de transformation s'attaquent aux problèmes réels plutôt que de mettre en œuvre la technologie pour le plaisir de la technologie. Elle permet également de hiérarchiser les initiatives en fonction de l'impact sur le client plutôt que des préférences internes.
Adopter une approche agile et itérative
La gestion traditionnelle des projets en cascade ne fonctionne pas bien pour la transformation numérique. Les exigences changent, les technologies évoluent et les attentes des clients changent au cours des initiatives pluriannuelles.
Les méthodologies agiles permettent aux organisations de fournir de la valeur de manière incrémentale, de tirer des enseignements de chaque version et d'ajuster les priorités en fonction des résultats. Cela permet de réduire les risques et de maintenir l'élan de l'organisation, même lorsque des initiatives spécifiques ne donnent pas les résultats escomptés.
Mesurer ce qui compte
Définir des indicateurs de réussite clairs avant de lancer des initiatives de transformation. Ceux-ci doivent être liés aux résultats de l'entreprise - valeur du cycle de vie des clients, taux de conversion, valeur moyenne des commandes, taux de satisfaction de la clientèle - plutôt qu'à des mesures vaniteuses telles que le nombre de pages vues ou de followers sur les médias sociaux.
Des mesures et des rapports réguliers permettent de responsabiliser les initiatives et d'alerter rapidement lorsque des ajustements sont nécessaires. Mais ne mesurez pas trop. Concentrez-vous sur les 5 à 7 mesures qui indiquent réellement si la transformation fonctionne.
| Élément de stratégie | Approche de la mise en œuvre | Indicateur de réussite |
|---|---|---|
| Conception centrée sur le client | Cartographie du parcours, développement de persona, retour d'information continu | Amélioration du taux de satisfaction, réduction du nombre de tickets d'assistance |
| Fondation pour la technologie | Infrastructure en nuage, architecture orientée vers les API, plates-formes évolutives | Temps de fonctionnement du système, vitesse d'intégration, mesures d'évolutivité |
| Décisions fondées sur des données | Mise en œuvre de l'analyse, tests A/B, connaissance des clients | Amélioration du taux de conversion, efficacité de la personnalisation |
| Alignement organisationnel | Équipes interfonctionnelles, gouvernance claire, soutien de l'exécutif | Vitesse des projets, satisfaction des employés, taux d'adoption |
| Amélioration continue | Rétrospectives régulières, culture de l'expérimentation, boucles d'apprentissage | Taux d'innovation, délai de mise sur le marché des nouvelles fonctionnalités |
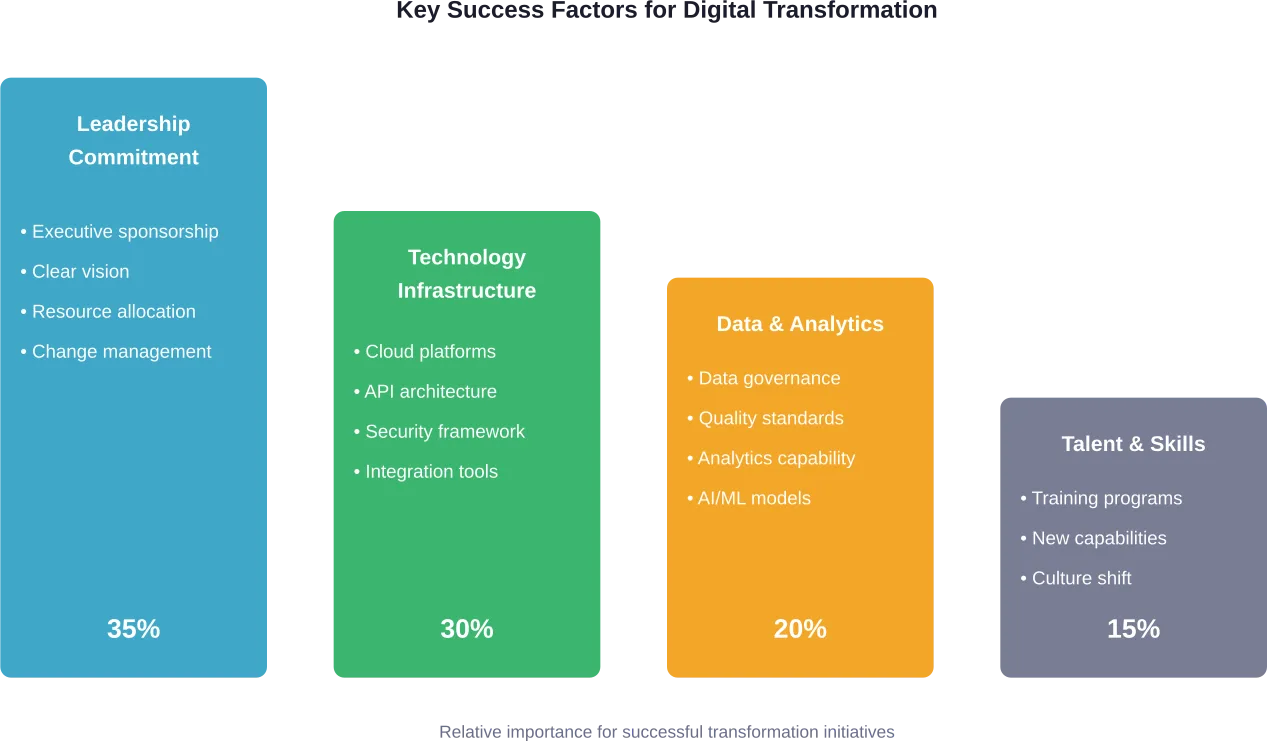
Investir dans la gestion du changement
La mise en œuvre des technologies représente peut-être 30% du travail de transformation. Les 70% restants concernent les personnes, les processus et la culture.
La gestion du changement commence par le parrainage de la direction et se répercute dans l'ensemble de l'organisation. Une communication claire sur l'importance de la transformation, la manière dont elle se déroulera et ce qu'elle implique pour les différents rôles permet de réduire les résistances et de créer une dynamique.
Le rôle du marketing dans la transformation B2C
Le marketing se situe à l'intersection de l'expérience client et de la technologie commerciale, ce qui le place au cœur des efforts de transformation.
L'étude de Forrester sur la transformation du marketing B2C souligne que les responsables marketing doivent faire face aux perturbations de l'IA, à la fragmentation du marché et à l'évolution des défis en matière de mesure. Les fondamentaux du marketing B2C restent importants, mais l'exécution nécessite de nouvelles capacités et approches.
Création d'une marque sur les canaux numériques
La transformation numérique n'élimine pas le besoin de marques fortes. En fait, avec la prolifération des canaux numériques et la fragmentation de l'attention des consommateurs, les marques distinctives deviennent encore plus précieuses.
Les entreprises B2C doivent trouver des moyens de développer la notoriété et l'affinité de leur marque par le biais de canaux numériques - marketing de contenu, engagement dans les médias sociaux, partenariats avec des influenceurs et création de communautés. Cela nécessite des compétences différentes de la publicité traditionnelle de la marque, mais sert le même objectif fondamental.
Naviguer dans l'IA et l'automatisation
L'IA générative crée à la fois des opportunités et des défis pour les spécialistes du marketing B2C. Elle permet la création de contenu à grande échelle, des interactions personnalisées avec les clients et des analyses prédictives sophistiquées.
Mais elle modifie également la manière dont les consommateurs découvrent les produits. Le comportement de recherche évolue à mesure que les outils alimentés par l'IA fournissent des réponses directes plutôt que des listes de liens. Les entreprises B2C doivent adapter leur présence numérique pour rester découvrables dans cet environnement changeant.
Les tendances émergentes qui façonnent l'avenir numérique de B2C
La transformation numérique n'est pas une destination, c'est un processus continu d'adaptation à l'évolution de la technologie et du comportement des consommateurs.
Intégration du commerce social
Les plateformes de médias sociaux fonctionnent de plus en plus comme des canaux de commerce, et non plus seulement comme des canaux de marketing. Les consommateurs découvrent des produits, recherchent des options, font des achats et partagent des avis, le tout dans des environnements sociaux.
Les entreprises B2C doivent intégrer le commerce social dans leur stratégie numérique globale, en créant des contenus achetables et des expériences de paiement transparentes sur les plateformes sociales, tout en maintenant une image de marque cohérente sur l'ensemble des canaux.
Commerce vocal et conversationnel
Les assistants vocaux et l'IA conversationnelle modifient la façon dont les consommateurs interagissent avec les marques. Bien que l'adoption ait été plus lente que ne le laissaient présager les premières prédictions, les achats et le service client à commande vocale continuent de se développer.
Les entreprises qui se préparent à ce changement se concentrent sur les principes de conception conversationnelle, les capacités de traitement du langage naturel et l'optimisation de la recherche vocale pour leur contenu numérique.
Durabilité et alignement des valeurs
Les recherches de Dartmouth sur les clients numériques montrent que les entreprises doivent s'aligner de plus en plus sur les valeurs de leurs clients. Les consommateurs prennent de plus en plus en compte les valeurs de la marque et les pratiques de développement durable dans leurs décisions d'achat.
La transformation numérique permet une plus grande transparence des chaînes d'approvisionnement, des pratiques d'achat et de l'impact sur l'environnement. Les entreprises B2C qui communiquent efficacement leurs valeurs et leurs pratiques par le biais des canaux numériques renforcent les relations avec leurs clients.
Mesurer le succès de la transformation
Comment les organisations peuvent-elles savoir si leurs efforts de transformation portent leurs fruits ? La réponse se trouve dans des indicateurs clairs liés aux résultats de l'entreprise.
Mesure de l'expérience client
Le Net Promoter Score (NPS), la satisfaction des clients (CSAT) et le Customer Effort Score (CES) mesurent tous différents aspects de la qualité de l'expérience. Suivez-les systématiquement avant et après les initiatives de transformation pour en quantifier l'impact.
Les mesures spécifiques au numérique, telles que les évaluations des applications, les scores de convivialité des sites web et les taux d'achèvement du parcours client, donnent un aperçu supplémentaire de la performance des points de contact numériques.
Indicateurs de performance des entreprises
La transformation doit en fin de compte générer des résultats commerciaux. Suivez des indicateurs tels que les taux de conversion, la valeur moyenne des commandes, la valeur de la durée de vie des clients et le coût d'acquisition des clients.
Comparez ces mesures entre les segments de clientèle, les canaux et les périodes de temps pour comprendre où la transformation apporte le plus de valeur et où un travail supplémentaire est nécessaire.
Gains d'efficacité opérationnelle
La transformation numérique devrait également améliorer l'efficacité opérationnelle. Surveillez les indicateurs tels que le temps de traitement des commandes, les taux de résolution du service client, la rotation des stocks et le coût opérationnel par transaction.
Ces gains d'efficacité permettent souvent de financer la poursuite des investissements de transformation, créant ainsi un cercle vertueux d'amélioration.
Questions fréquemment posées
- Qu'est-ce que la transformation numérique pour les entreprises B2C ?
La transformation numérique pour le B2C implique l'intégration des technologies numériques dans l'ensemble des opérations en contact avec les consommateurs afin de changer fondamentalement la façon dont les entreprises apportent de la valeur et interagissent avec les clients. Il s'agit notamment de moderniser les systèmes, de créer des expériences omnicanales transparentes, d'exploiter les données pour la personnalisation et d'adopter des principes de conception centrés sur le client à tous les points de contact.
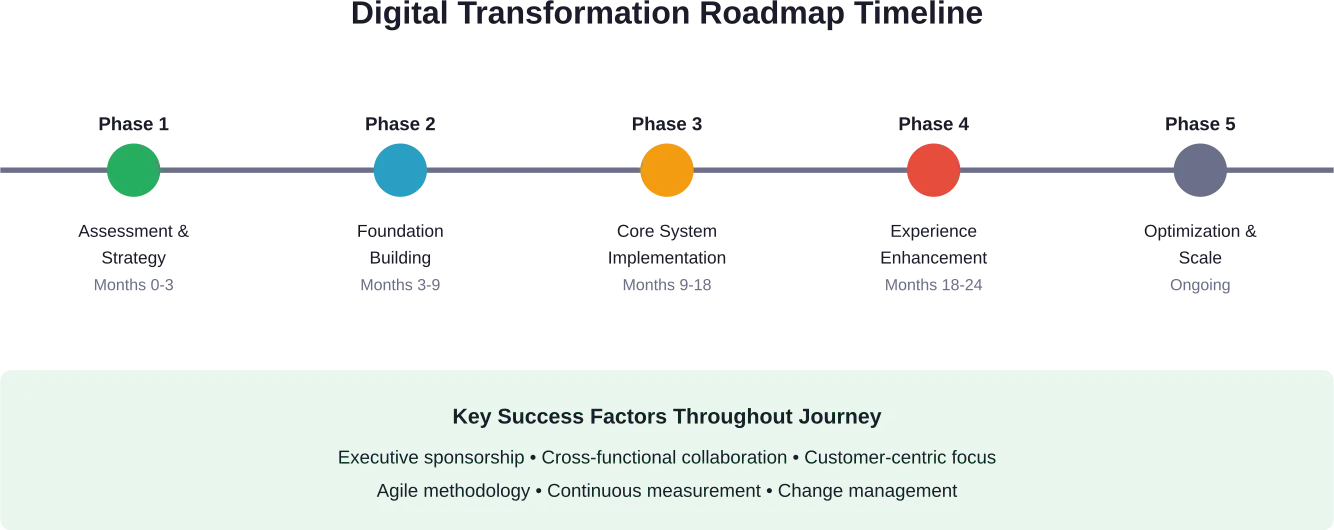
- Combien de temps dure la transformation numérique B2C ?
La plupart des transformations numériques B2C complètes nécessitent 18 à 24 mois pour une mise en œuvre de base, bien que les organisations doivent considérer la transformation comme un processus continu plutôt que comme un projet ponctuel. Des gains rapides peuvent être obtenus en 3 à 6 mois grâce à des initiatives ciblées, tandis que le renforcement des capacités fondamentales prend généralement 9 à 12 mois. Le calendrier varie en fonction de la taille de l'organisation, de la complexité des systèmes existants et de l'ampleur de la transformation.
- Quels sont les plus grands défis de la transformation numérique B2C ?
Les défis les plus courants sont l'intégration des systèmes existants, la résistance de l'organisation au changement, le respect de la confidentialité des données, les contraintes budgétaires et le manque de compétences. De nombreuses organisations ont également du mal à définir des indicateurs de réussite clairs et à maintenir le soutien de la direction tout au long des initiatives pluriannuelles. Pour relever ces défis, il faut une planification stratégique, un investissement dans la gestion du changement et des approches de mise en œuvre progressive.
- Quel est le coût de la transformation numérique B2C ?
Les coûts de transformation varient considérablement en fonction de la taille et de la portée de l'entreprise. Une étude de la Columbia Business School a mis en évidence une transformation réussie de l'expérience client sur des budgets d'environ $300 000 pour les petites initiatives, alors que les transformations à l'échelle de l'entreprise dans les grandes sociétés B2C peuvent nécessiter des investissements de plusieurs millions de dollars. La plupart des entreprises devraient consacrer 2 à 5% de leur chiffre d'affaires annuel à des travaux de transformation significatifs.
- Les entreprises B2C doivent-elles reconstruire l'ensemble de leurs technologies ?
Le remplacement complet de la technologie n'est ni nécessaire ni conseillé pour la plupart des organisations. Les transformations réussies impliquent généralement une modernisation progressive : ajout de couches API pour connecter les systèmes existants aux plateformes modernes, migration de fonctions spécifiques vers des solutions basées sur le cloud et remplacement progressif des systèmes obsolètes en fonction des priorités de l'entreprise. Cette approche réduit les risques tout en maintenant la continuité de l'activité.
- En quoi la transformation numérique B2C diffère-t-elle de la transformation numérique B2B ?
La transformation du B2C se concentre sur les transactions à fort volume et à faible valeur ajoutée, avec des cycles de décision plus courts et des motivations d'achat plus émotionnelles. Les attentes des consommateurs en matière de rapidité, de commodité et de personnalisation sont plus élevées, sous l'influence des principales plateformes numériques. Le B2C traite également des bases de clients plus importantes, nécessitant des systèmes plus évolutifs et des approches de gestion des données différentes par rapport aux contextes B2B.
- Quel rôle joue le marketing dans la transformation numérique B2C ?
Le marketing se trouve au centre de la transformation B2C, reliant l'expérience client à la technologie de l'entreprise. L'étude de Forrester montre que les responsables marketing doivent faire face aux perturbations de l'IA, à l'évolution des pratiques de mesure et à la fragmentation du marché, tout en conservant les fondamentaux de la construction de la marque. Les équipes marketing pilotent la stratégie des données clients, la conception de l'expérience omnicanale et les tactiques d'engagement numérique qui ont un impact direct sur la réussite de la transformation.
Aller de l'avant avec la transformation numérique
La transformation numérique pour les entreprises B2C représente un impératif stratégique, et non une initiative facultative. Les attentes des consommateurs ne cessent de croître, la pression concurrentielle s'intensifie et les capacités technologiques se développent - les organisations qui ne s'adaptent pas risquent de perdre leur pertinence.
Mais la transformation ne nécessite pas de budgets colossaux ni de remplacement complet des opérations existantes. Les initiatives les plus réussies commencent par des objectifs clairs centrés sur le client, développent progressivement les capacités fondamentales et maintiennent l'attention de l'organisation grâce au parrainage de la direction et à la gestion du changement.
La voie à suivre consiste à cartographier les parcours actuels des clients, à identifier les opportunités à fort impact, à sélectionner les technologies appropriées et à mettre en œuvre les changements grâce à des méthodologies agiles qui permettent d'apprendre et de s'adapter. La réussite exige de la patience, de la persévérance et la volonté de s'adapter à l'évolution des circonstances.
Les organisations qui adoptent la transformation numérique de manière réfléchie se positionnent pour une croissance durable sur des marchés de plus en plus numériques. Celles qui tardent à le faire sont confrontées à des défis de plus en plus importants, car le fossé entre les leaders numériques et les retardataires ne cesse de se creuser. Le moment de commencer n'est pas celui où la transformation devient confortable, c'est maintenant.